Puneet0130
PremiumPower Grid – Breakout Plan Watching for a clean move above ₹300 level. Hourly chart shows Cup & Handle formation, while Daily/Weekly has Flag pattern attempting breakout. ✅ Breakout level: ₹300 (confirmation close needed) ✅ Stop-loss: ₹290–294 (below support / ATR-based) ✅ Target 1: ₹328 (Fibonacci 0.618 – Golden Ratio) ✅ Target 2: ₹375 (Measured...
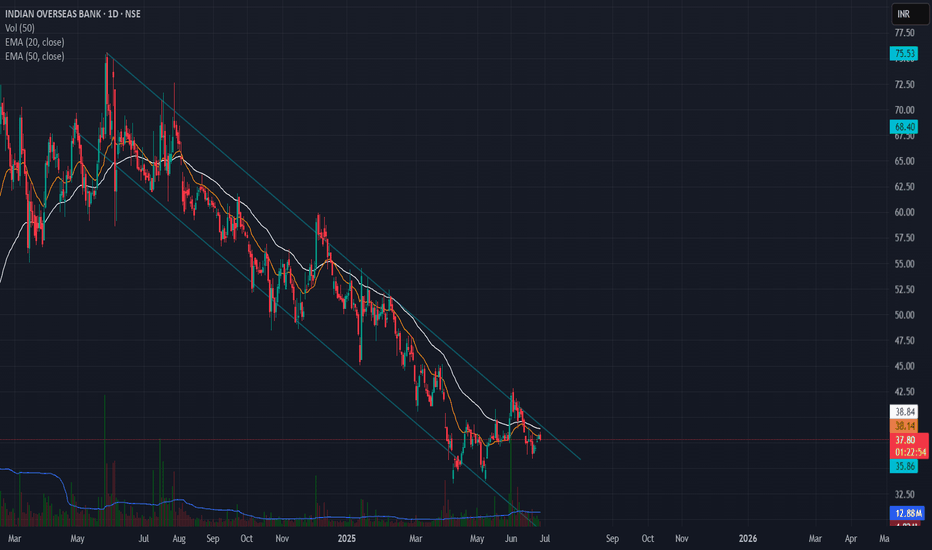
📈 Indian Overseas Bank (IOB) – Falling Channel Breakout Setup Watching a classic falling channel on the daily timeframe with multiple touches on both trendlines. Recent breakout above ~38.8 confirms the channel break. ✅ Planned Trade Details: - Entry above 38.8 (confirmation) - Stop-loss: 35.90 - ATR-based stop option: ~37.45 for tighter risk control - Target...
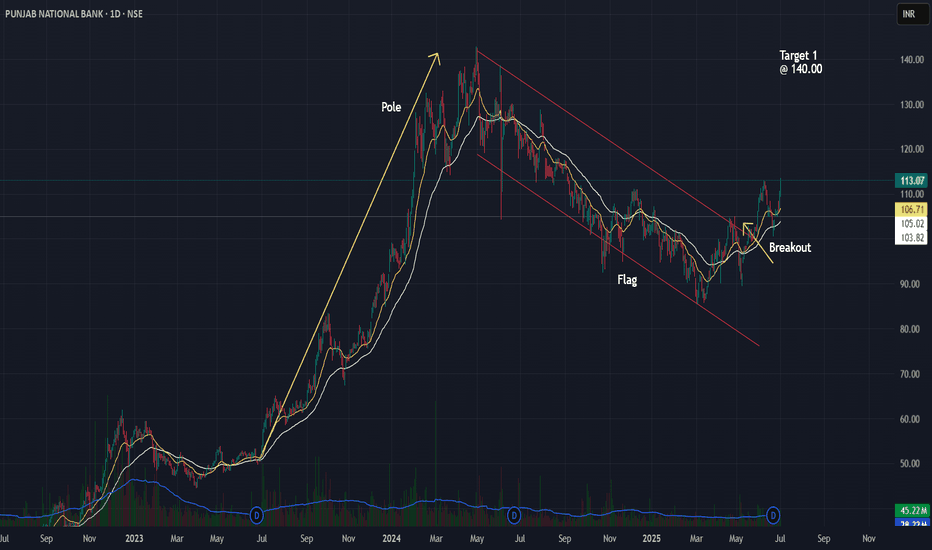
📈 Punjab National Bank (PNB) – Flag Breakout Setup Observed a classic flag pattern on the daily chart after a strong pole move in 2023–24. ✅ Breakout above the channel confirmed with price action near 113. ✅ Entry plan: Watch for daily close >113 with volume. ✅ Stop-loss idea: Below 106. ✅ Target 1: 140 (first swing resistance). ✅ Measured move projection...
📌 NIFTY Weekly Chart – Double Bottom Breakout Analysis After a long corrective phase, NIFTY is forming a classic Double Bottom pattern on the weekly timeframe. This is typically a bullish reversal signal. ✅ Pattern: Double Bottom on Weekly Chart ✅ Bottom Levels: ~21,800 ✅ Neckline Resistance: ~26,200 📈 Breakout Strategy: Watch for a weekly close above 26,200...
📌 USD/INR Weekly Chart – Double Top Analysis After a sustained uptrend, USD/INR is showing potential signs of a reversal with a well-defined Double Top pattern on the weekly timeframe. ✅ Pattern: Double Top (Weekly) ✅ Key Resistance: ~87.00 (tops) ✅ Breakdown Level: 83.76 (watch for confirmed weekly close below) ✅ Target Projection: ~80.76 (based on measured...
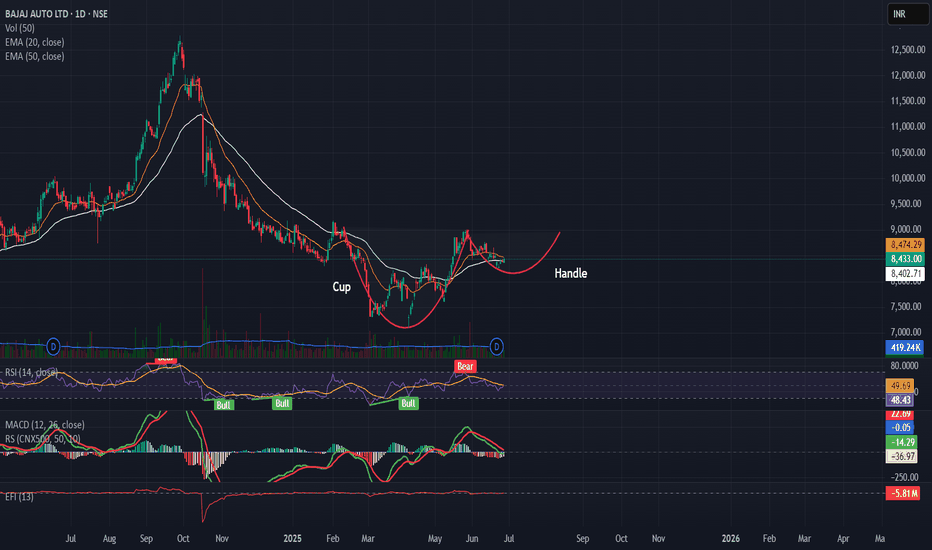
After a 9 month long downtrend Bajaj Auto shows signs of reversal with a Cup and Handle pattern in the making with neckline breakout level at 9000 The stock trading close to the 20 and 50 EMA RSI closing 50 MACD begins to stabalize Target 11000 stoploss 8250
📉 IOB (Indian Overseas Bank) - Falling Channel Setup 🔍 Daily Chart Analysis – June 26, 2025 IOB has been trading within a well-defined falling channel since early 2024. Price is currently testing the upper boundary of the channel but hasn’t confirmed a breakout yet. 🔑 Key Observations: Structure: Clearly respecting the falling channel. Moving Averages: Price...
Grasim Cup and Handle Breakout Setup Grasim is forming a classic Cup and Handle pattern on the daily chart. ✅ Breakout Level: 2790 🛑 Stoploss: Below 2650 (handle low) 🎯 Target Zone: 3290 (based on depth projection and prior highs) Pattern Logic: Rounded cup base indicates accumulation Handle pullback was shallow with declining volume Breakout attempt with...
🔹 Pattern: Symmetrical Triangle 🔹 Breakout Level: ₹660 🔹 Stoploss: ₹635 (below swing low) 🔹 Target Zone: ₹850 – ₹900 🔹 Risk–Reward: 7.6 – 9.6 🔹 Timeframe: Positional (swing to medium term) --- 📊 Chart Analysis: Hindalco has broken out of a well-defined symmetrical triangle on the daily chart, with strong price compression followed by bullish breakout...
Gold is currently testing a rising trendline on the daily/weekly chart. A trendline breakdown could signal a shift from bullish to corrective phase. If the trendline breaks, the structure suggests: Stop-loss: ₹101,000 Target 1: ₹90,000 Target 2: ₹86,000 This aligns with a potential retracement before the next macro wave (e.g., Fed rate cut cycle or global...
Symmetrical Triangle Breakout Setup Torrent Pharmaceuticals Ltd (TORNTPHARM) Breakout Level: ₹3,300 Stop Loss: ₹3,150 (below triangle support) Target: ₹4,000 (based on height of triangle) Risk:Reward: ~2.8:1 ✅ Technical Confirmation: RSI near 52 — momentum shifting bullish above 55. MACD positive crossover, rising histogram — trend strength improving. Volume:...
HclTech is showing six months long inverse head and shoulders pattern with major resistance at 1750. RSI at 58 MACD is above its signal line and trending higher. Efi Is above zero and is stable right now target at 2140-2400 based on the pattern
Banknifty heading downwards after India Pakistan conflict started. As Banknifty fills the upward gap with Increased Volume and RSI,OBV sloping downward. Possible support @51900 Resistance @ 53800
Natural Gas Breakdown from the rising trend line After making high of 408. Natural Gas in reversing downwards and breaking down from the rising trend line with strong volume and RSI,OBV also breaking down from the rising trend line. which shows strong downtrend Entry Price < 333.00 Target @ 236.00 Stoploss @ 366.00
After correcting for more than 5 months and taking support at crucial level of 21800 which was pre election low, Nifty 50 is looking strong and set to resume new leg of uptrend. Nifty 50 is ready to cross falling channel at strong volume and macd crossing macd signal line. stoploss - 21800 Target - 26300
Banknifty price breakout from falling channel with macd crossing macd signal line. target- 50600 stoploss- 48000
Silver is ready to move up, as it close to break the falling trendline and resistance @96373 level and rsi and obv is breaking above falling trendline stoploss below 95209 Target above 100500
FSL is breaking out of ascending triangle with increased volume. Stoploss:370.00 Target:442.00 NSE:FSL


