How to use Head n Shoulder / Inv. Head n Shoulder Chart Pattern.Hello Friends,
Welcome to RK_Chaarts,
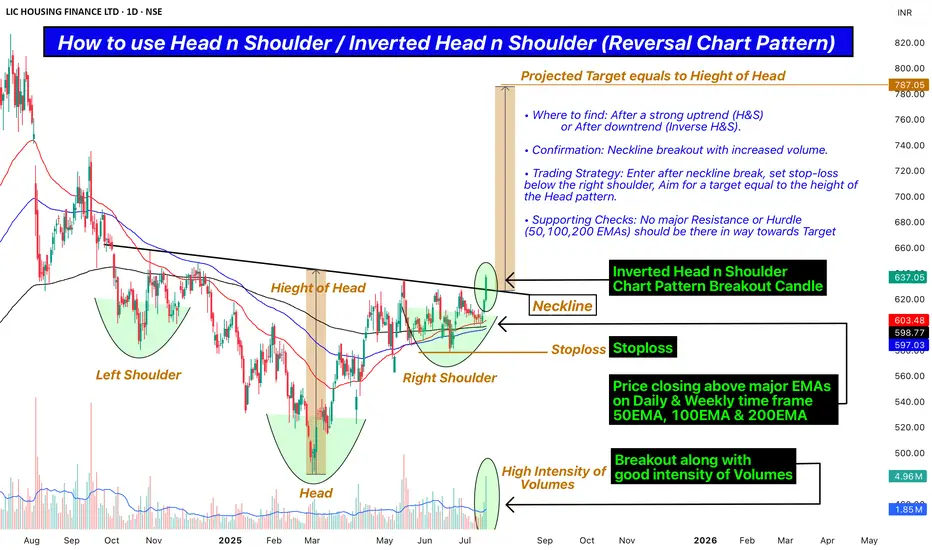
Today we are going to Learn how to use Head n Shoulder / Inverted Head n Shoulder (Reversal Chart Pattern) as a Professional Trader along with real terms to check, Confirm and apply.
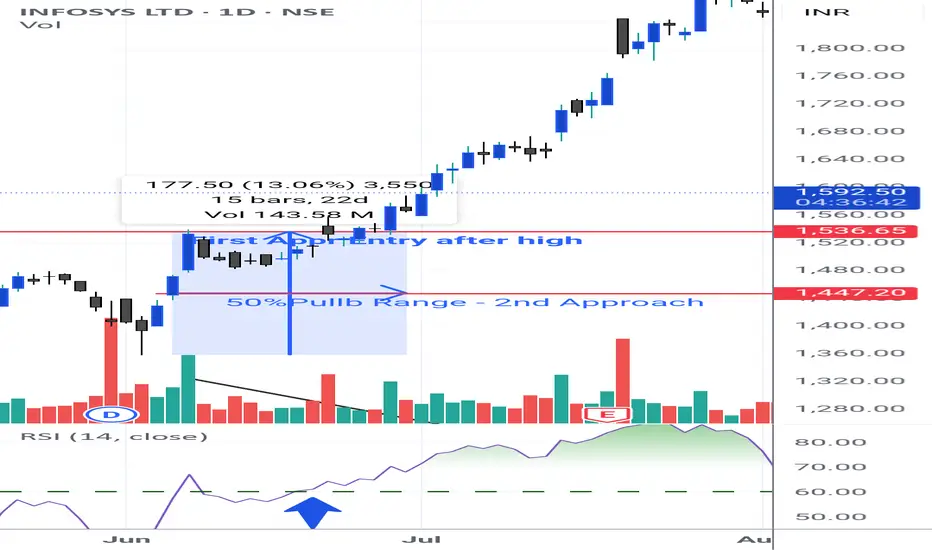
• Where to find: After a strong uptrend (H&S) or After downtrend (Inverse H&S).
• Confirmation: Neckline breakout with increased volume.
• Trading Strategy: Enter after neckline break, set stop-loss below the right shoulder, Aim for a target equal to the height of the Head pattern.
• Supporting Checks: No major Resistance or Hurdle (50,100,200 EMAs) should be there in way towards Target.
This post is shared purely for educational purpose & it’s Not a trading advice.
I am not Sebi registered analyst.
My studies are for educational purpose only.
Please Consult your financial advisor before trading or investing.
I am not responsible for any kinds of your profits and your losses.
Most investors treat trading as a hobby because they have a full-time job doing something else.
However, If you treat trading like a business, it will pay you like a business.
If you treat like a hobby, hobbies don't pay, they cost you...!
Hope this post is helpful to community
Thanks
RK💕
Disclaimer and Risk Warning .
The analysis and discussion provided on in.tradingview.com is intended for educational purposes only and should not be relied upon for trading decisions. RK_Chaarts is not an investment adviser and the information provided here should not be taken as professional investment advice. Before buying or selling any investments, securities, or precious metals, it is recommended that you conduct your own due diligence. RK_Chaarts does not share in your profits and will not take responsibility for any losses you may incur. So Please Consult your financial advisor before trading or investing.
Community ideas
Swing Trading - Pullback and Volume contraction setup - PROA pullback entry with volume contraction is a powerful setup used by swing traders and position traders to enter strong trends at low-risk points. Here's how you can identify and trade this setup:
✅ Concept:
• A pullback is a temporary decline in price within an established uptrend.
• Volume contraction during this pullback shows reduced selling pressure, indicating that the correction is healthy and likely to resume upward.
📊 Technical Setup:
1. Trend Filter
• Uptrend confirmation using:
• Monthly RSI > 60
• Weekly RSI > 60
• 50 EMA above 200 EMA on Daily chart (optional confirmation)
2. Price Action
• Stock is making higher highs and higher lows
• After a sharp rally, price pulls back 3–5 candles on the Daily chart
• Pullback should be orderly (no panic selling or wide candles)
3. Volume Contraction
• Volume decreases gradually during the pullback
• Look for lowest volume near the end of the pullback
• Indicates sellers are drying up and big players are not exiting
4. Entry Trigger
• Entry when price breaks above previous day's high with:
• Spike in volume on breakout
• Optional: bullish candlestick (Marubozu, Bullish Engulfing, or Hammer)
5. Stop Loss
• Just below the pullback low or
• Below the 10 EMA on daily chart
6. Target
• First target = previous swing high
• Trail SL using ATR or 20 EMA if trend extends
📘 Example:
Let’s say you’re watching Tata Motors:
• Monthly RSI = 68
• Weekly RSI = 65
• Daily chart: Stock rallied from ₹800 to ₹860, then pulls back to ₹840 with 3 red candles
• Volume during pullback: 12M → 10M → 7M → 5M
• On Day 4, price forms a bullish hammer and breaks ₹845 on higher volume
📈 Entry = ₹845
🛑 Stop Loss = ₹835
🎯 Target = ₹865+ (prior high), trail after that
🔍 Bonus Filters (Optional):
• Inside bar formation
• Fibonacci retracement (38.2%–50% zone)
• Near support from moving averages (20 EMA / 50 EMA)
Check my previous post in understanding full concept in detail. Support and follow for PRO level understanding. Share with as many retail traders as possible.
God Bless you All!
Faraaz T
Sr. Equity Research Analyst
Stockholm Securities - UK
RIDE THE BIG MOVESWhat Does “Ride the Big Moves” Mean?
It means:
✅ Spotting a strong directional move early
✅ Entering with confirmation and confidence
✅ Managing your risk while maximizing reward
✅ Staying in the trade through minor pullbacks
✅ Exiting smartly at a major trend exhaustion point
Most traders cut winners early and let losers run. This approach flips that pattern — teaching you how to stay in profitable trades and compound gains.
🧠 Core Concepts You’ll Learn
1. Trend Identification
Learn how to identify:
Primary trends (uptrend/downtrend)
Pullbacks vs. reversals
Trend strength using price action and volume
Higher-timeframe confirmation
2. Entry Techniques for Big Moves
Breakout from consolidation
Trendline and moving average support
SMC-based entries: Order blocks & market structure shifts
Avoiding fakeouts with volume and time confirmation
3. Stay in the Move
How to manage fear during winning trades
Trailing stop techniques: MA trail, swing low method, ATR
Adding to positions safely in trending markets
Avoiding premature exits caused by emotions
4. Exit Like a Pro
Identifying exhaustion signals
Divergences, volume drops, or climax candles
Scaling out profits strategically
Avoiding full exit too early — ride until structure breaks
📊 Why Big Moves Matter
Let’s say your risk is ₹1,000 per trade.
In a scalp, you might make ₹1,500.
In a small swing, maybe ₹3,000.
But if you ride a big move, your reward could be ₹10,000 or more — with the same risk.
That’s the power of risk-reward optimization — where one big move can cover multiple small losses and lift your win ratio significantly.
👨🏫 Who Should Learn This?
Intraday and swing traders
Option buyers looking for momentum moves
Long-term investors who want better timing
Anyone tired of small profits and early exits
✅ What You’ll Achieve:
Learn to identify market momentum early
Improve patience and discipline
Build strategies that favor 1:5 or even 1:10 risk-reward setups
Confidence to hold winners without panic
Eliminate noise and trade with clarity
⚡ Start Riding Waves, Not Ripples
“Ride the Big Moves” is more than a strategy — it's a mindset shift. It teaches you how to think like professionals who don’t chase trades, but wait for the market to offer big, clean opportunities — then ride them with focus and control
Institutional Objectives in Options TradingWhy Do Institutions Trade Options?
Institutions such as hedge funds, banks, mutual funds, and insurance companies trade options not to “hit it big,” but to:
Protect capital
Generate consistent income
Reduce portfolio risk
Hedge exposure
Speculate with calculated risk
They use options as a tool, not a shortcut.
🎯 Key Institutional Objectives in Options Trading
1. Portfolio Hedging
Institutions use put options to hedge large equity portfolios. If the market drops, the puts increase in value, helping offset losses in their stock holdings. This is like buying insurance — they sacrifice a small premium to avoid larger losses.
Example:
A mutual fund holding ₹100 crores in Nifty stocks might buy at-the-money puts on Nifty to protect against market crashes.
2. Risk Management & Exposure Control
Institutions manage their exposure to volatility, direction, and time decay using the Greeks (Delta, Gamma, Theta, Vega). They dynamically adjust their positions to stay delta-neutral or reduce gamma risk, maintaining stable portfolios under different market conditions.
They don’t just bet — they engineer their risk.
3. Premium Collection Strategies
Big players often sell options — not buy them — to earn steady income. Strategies like:
Covered Calls
Iron Condors
Credit Spreads
Calendar Spreads
allow them to profit from time decay (Theta) and implied volatility drops, especially in range-bound markets.
Example:
An institution expecting low volatility might sell both calls and puts (straddle or strangle) and pocket the premium as long as the market stays quiet.
4. Arbitrage and Market-Making
Institutions engage in option arbitrage, exploiting price inefficiencies between spot, futures, and options. They also act as market makers, providing liquidity and earning from bid-ask spreads while balancing risk using delta hedging.
This is a low-risk, high-volume business built on speed, data, and precision.
5. Speculation with Defined Risk
When institutions do speculate, they often use options to limit downside risk. For example, they may buy calls to play an upside breakout — knowing their maximum loss is limited to the premium paid.
They might also take advantage of event-driven trades like earnings, elections, or economic reports using option straddles or strangles — managing risk while targeting large moves.
✅ Why It Matters for Retail Traders
By understanding institutional objectives, you can:
Avoid emotional trades
Learn how to trade like professionals
Focus on capital preservation and risk-adjusted returns
Develop long-term strategies based on logic, not luck
📈 Final Thought
Institutions don’t gamble — they plan, hedge, and execute with precision. Learning their objectives in options trading will help you shift your mindset, adopt safer strategies, and build consistent, professional-level performance in the market.
Technical Class📘 What is Technical Analysis?
Technical analysis is the study of past market data — mainly price and volume — to forecast future price movement. Unlike fundamental analysis (which looks at company financials), technical analysis focuses entirely on what is happening on the chart right now.
It’s based on three core principles:
Price Discounts Everything
Price Moves in Trends
History Repeats Itself
By mastering this, you can trade like a professional — with logic, structure, and discipline.
🔧 What You’ll Learn in the Technical Class
This class covers all the essential tools, techniques, and strategies used by full-time traders and institutions. Key topics include:
🔹 1. Charting Basics
Types of charts: Candlestick, Line, Bar
Timeframes: 1-min to monthly charts
How to set up charts for analysis
🔹 2. Candlestick Patterns
Bullish and bearish candlesticks
Reversal vs. continuation patterns
Psychology behind candlestick formations (e.g., Doji, Engulfing, Hammer)
🔹 3. Support & Resistance
How to identify key price levels
Role of horizontal zones and trendlines
Breakout and retest strategies
🔹 4. Chart Patterns
Double Top & Bottom
Head and Shoulders
Flags, Pennants, Triangles
Price action and pattern recognition techniques
🔹 5. Technical Indicators
Moving Averages (SMA, EMA)
RSI, MACD, Bollinger Bands
Volume Profile, VWAP
When to use and when to avoid indicators
🔹 6. Trend Analysis
Identifying uptrends, downtrends, sideways movement
Using higher timeframes for confirmation
Entry and exit based on trend strength
🔹 7. Volume Analysis
Importance of volume in confirming moves
Volume spikes and trap zones
Institutional activity detection
🧠 Why Technical Analysis Matters
Most professional traders rely heavily on technicals for:
Short-term and intraday trading
Identifying breakout and breakdown zones
Predicting reversals and continuation setups
Aligning with smart money and institutional behavior
It is one of the most practical skillsets you can learn in trading.
🎯 Who Should Join This Class?
Beginners in the stock market
Aspiring intraday/swing traders
Investors who want better timing
Crypto, forex, or index traders
📈 Conclusion: Read the Market Like a Pro
The Technical Class will give you the confidence to read charts, spot opportunities, and manage trades with structure — no more relying on tips or guesswork.
You’ll walk away with real, practical skills that you can apply in any market, any timeframe, any strategy
How To Use Money Flow Index (MFI) Indicator ??? the money flow index (mfi) is a momentum indicator that uses both price and volume to measure buying and selling pressure
🧠 unlike rsi, which only considers price, mfi gives deeper insights by combining volume into the calculation
mfi values range from 0 to 100
1)above 80 = overbought zone
2)below 20 = oversold zone
🔍 traders use mfi to spot potential reversals, divergences, and to confirm trends
🛠️ you can combine mfi with other indicators like moving averages or support/resistance for better decision-making
🧪 test it on different timeframes to understand how it behaves with your strategy
Disclaimer :
This idea post is not financial advice, it's for educational purposes only, I am not a SEBI-registered advisor. Trading and investing involve risk, and you should consult with a qualified financial advisor before making any trading decisions. I do not guarantee profits or take responsibility for any losses you may incur.
Trading Master Class 1. Understanding Financial Markets
The course starts with a strong foundation in how financial markets work. You’ll learn the difference between investing and trading, the role of exchanges (like NSE, BSE, NYSE), and how different participants — including retail traders, institutions, brokers, and market makers — influence the market.
You’ll also understand key trading instruments such as:
Stocks (Equities)
Indices (Nifty, Sensex, Dow Jones)
Options & Futures
Commodities and Currencies
This foundation helps in selecting the right markets and strategies for your trading style.
2. Technical Analysis & Chart Reading
Technical analysis is the core tool used by traders to make entry and exit decisions. In this section, you’ll master:
Candlestick Patterns (Doji, Hammer, Engulfing)
Support & Resistance Levels
Chart Patterns (Head & Shoulders, Triangles, Flags)
Volume Analysis
Trend Identification
You’ll also get hands-on experience with popular indicators like Moving Averages, RSI, MACD, and Bollinger Bands — learning when and how to use them effectively.
3. Institutional Trading Concepts
This section reveals how big institutions (smart money) operate and how they trap retail traders. You’ll learn advanced concepts like:
Market Structure
Order Blocks
Liquidity Grabs
Break of Structure (BoS)
Supply and Demand Zones
These concepts help you align your trades with institutional movements, giving you a powerful edge.
4. Strategy Development
You’ll be guided through the process of developing your own trading strategy based on market conditions and personal risk appetite. This includes:
Identifying setups
Entry and exit rules
Risk-reward calculations
Journaling and performance tracking
Backtesting strategies with real data
The focus is on clarity, simplicity, and consistency.
5. Options Trading Simplified
Options are a powerful tool for both hedging and profit. This module covers:
Basics of Calls and Puts
Options Buying vs. Selling
Option Greeks (Delta, Theta, Vega)
Strategies like Covered Calls, Iron Condors, Spreads
Intraday and expiry-day strategies
6. Risk Management & Trading Psychology
No trading system works without discipline and emotional control. This part of the course trains your mindset to handle:
Fear of loss
Greed during profits
Revenge trading
Overtrading
Proper position sizing and capital allocation
You’ll build habits to stay consistent — the key to long-term success.
Summary:
The Trading Master Class is not just about charts or indicators — it’s about learning the right way to trade, with a focus on:
Market knowledge
Strategy building
Institutional concepts
Risk control
Trading psychology
It’s the complete path to becoming a smart, confident, and consistently profitable trader.
Tech & Digital Transformation (AI, Automation, EV)Introduction
We live in a time where machines can think, cars can drive themselves, and businesses are run by algorithms and automation. This isn’t a sci-fi movie — it’s happening now.
In 2025, the technology and digital transformation wave is in full swing in India. From Artificial Intelligence (AI) to robotic automation, and from electric vehicles (EVs) to cloud-based services, industries across the board are being reshaped.
This isn’t just about fancy tech buzzwords. It’s about:
Creating new businesses
Changing how old industries operate
Giving rise to new investment and trading opportunities
Let’s break down this major trend in a way that’s simple, clear, and real — so whether you’re a trader, investor, student, or entrepreneur, you’ll understand exactly what’s going on and how you can benefit.
🔍 What Is Digital Transformation?
Digital Transformation means using technology to make businesses smarter, faster, and more efficient.
For example:
A factory installs sensors and AI software to reduce waste
A hospital uses AI to detect diseases faster
A cab company replaces petrol cars with electric vehicles and uses an app to manage rides
It’s not just about using computers — it’s about rethinking how we do things using modern technology.
🚀 What’s Driving the Tech Transformation in 2025?
Let’s look at what’s fueling this massive shift:
✅ 1. Government Support & Policies
India’s government is pushing hard for:
AI adoption in governance, education, and healthcare
EV ecosystem with PLI schemes, subsidies, and charging infra
Digital India 2.0 for internet access, 5G, and digital services
This strong policy backing is giving tech companies the freedom to scale quickly.
✅ 2. Rise of Young Tech-Savvy Population
India has over 700 million internet users and a median age of 29. That means:
More digital consumption
More startups building tech products
More users adopting AI, EVs, and online services
✅ 3. Global Tech Trends Are Local Now
AI models like ChatGPT, MidJourney, and Copilot are being used in:
Schools
Small businesses
Customer service
Indian firms are localizing this tech — using it for regional languages, agriculture, finance, etc.
✅ 4. Corporate India Is Adopting Automation
From TCS to Tata Steel, companies are:
Automating HR, finance, supply chains
Using AI for predictive maintenance and demand forecasting
Adopting cloud computing for scale and security
This saves time, reduces cost, and improves profits — which markets love.
🧠 Let’s Dive Into 3 Key Areas
1️⃣ Artificial Intelligence (AI)
💡 What is AI?
AI is when machines are programmed to “think” like humans — they learn from data and make smart decisions.
Examples:
Google Maps finding fastest routes
YouTube recommending videos
Chatbots answering your bank queries
Indian AI Stocks to Watch
Tata Elxsi – AI in automotive, healthcare, media
Persistent Systems – AI in BFSI and digital transformation
Happiest Minds – AI-powered automation, analytics
LTTS (L&T Tech) – AI in industrial automation
Cyient DLM – Smart systems for defence and manufacturing
📈 Why AI Is a Hot Investment Theme
AI is not just a cost-saver — it creates entirely new business models
Global demand is exploding (even SMEs are adopting it)
India has rich data + cheap talent = AI leadership potential
2️⃣ Automation & Robotics
🤖 What is Automation?
Automation is when machines or software handle repetitive tasks without human help.
From factory robots to chatbots, automation is everywhere.
🏭 Where India Is Using Automation in 2025
Smart Factories: Robots assembling products, AI managing inventory
Warehousing: Amazon-style automated fulfillment
Banks: Robotic Process Automation (RPA) for account management, KYC
Transportation: Drones for delivery, automated traffic systems
🧑💼 Impact on Jobs & Skills
While some repetitive jobs may reduce, automation is creating new roles in:
Robotics management
AI training and supervision
Tech repair and integration
Data analytics
In short: Humans + Machines = Powerful combo
📊 Indian Automation Stocks to Watch
ABB India – Robotics & factory automation
Honeywell Automation – Process control tech
KPIT Tech – Automotive software automation
LTTS – Industrial and smart city automation
Tata Elxsi – Automation in EVs, healthcare, and rail
3️⃣ Electric Vehicles (EVs)
⚡ What are EVs?
EVs are vehicles powered by electric batteries instead of petrol/diesel.
They are:
Cleaner (no tailpipe emissions)
Cheaper to run (₹1/km vs ₹6/km for petrol)
Quieter and more efficient
🚗 Why India Is Going Electric in 2025
High petrol/diesel prices
Pollution control targets
Government incentives (FAME II, state subsidies)
Massive charging infra expansion
🏭 Companies Driving the EV Revolution
EV Manufacturers:
Tata Motors – India’s EV leader (Nexon EV, Tiago EV)
Mahindra & Mahindra – Born-EV architecture
Ola Electric – Two-wheelers and upcoming EV cars
Battery & Charging:
Exide Industries
Amara Raja Energy
Servotech Power
HBL Power Systems
Ancillary (parts, controllers, software):
Sona Comstar
Samvardhana Motherson
Electra EV (private)
📈 EV Investment Trend
Investors are eyeing battery tech, charging infra, and lightweight materials
Many EV stocks are already multi-baggers
PLI Scheme for battery storage and EV parts = big boost
📊 Performance Snapshot: Tech & Digital Leaders (Jan 2023 – July 2025)
Stock Jan 2023 Price July 2025 Price Approx. Gain
Tata Elxsi ₹6,500 ₹10,200 57%+
LTTS ₹3,800 ₹6,200 63%+
KPIT Tech ₹750 ₹1,560 108%+
Persistent Systems ₹4,000 ₹6,850 71%+
Servotech Power ₹45 ₹210+ 360%+
Tata Motors ₹400 ₹950+ 130%+
🧭 The Bigger Picture: Digital India 2.0
The Indian government is pushing:
5G/6G rollout
Smart city automation
AI in governance
Digital healthcare
Universal EV adoption by 2030
All of this means huge tailwinds for technology companies, startups, and R&D investments.
✅ Final Thoughts
The Tech & Digital Transformation theme in 2025 is not a bubble — it’s a fundamental shift in how India works, moves, learns, and grows.
AI is no longer future tech — it’s today’s business driver.
Automation is making Indian industries globally competitive.
EVs are no longer a dream — they’re on every city road.
This megatrend is not going away anytime soon. Whether you’re an investor, trader, or entrepreneur, now is the time to understand, explore, and ride the digital wave
Power & Utilities in 2025 Introduction: Why Power & Utilities Are Buzzing in 2025
Imagine running a growing city — there are electric buses on the roads, factories running 24/7, smart homes everywhere, and electric cars being charged in every neighborhood. Behind all of this is one invisible but powerful engine: electricity.
In 2025, India's power and utility sector is not just surviving — it is booming, evolving, and attracting massive investor interest. Whether it’s traditional power giants like NTPC or new-age energy plays like Tata Power and Servotech, this space is heating up because:
Power demand is at an all-time high
Government support is stronger than ever
Clean energy goals are transforming old players
The PLI scheme (Production Linked Incentive) is pushing domestic manufacturing
This is not just another sectoral rally — it's a structural shift. Let’s explore what’s driving this change and what it means for traders and investors in simple language.
🔌 What Is the Power & Utilities Sector?
The power and utilities sector includes companies that:
Generate electricity (thermal, hydro, solar, wind, nuclear)
Transmit and distribute it to homes, businesses, and factories
Make components like transformers, wires, batteries, solar modules
Operate infrastructure like smart grids, substations, power lines
These are the companies that light up India, literally.
Traditionally, this sector was slow-moving and PSU-dominated. But now, with renewables, EV charging, energy storage, and smart grids, it’s become a major growth story.
🌟 What’s Driving the Power Sector Boom in 2025?
Let’s break this into 6 easy-to-understand points:
✅ 1. Exploding Electricity Demand
India’s electricity demand is growing at 8–10% annually, faster than any major economy. Why?
Urbanization
More factories and data centers
EV charging needs
Heatwaves and air conditioners
Rural electrification
In short: More people + more machines = more electricity needed
✅ 2. Government Push for Renewable Energy
India is aiming for 500 GW of non-fossil fuel energy by 2030. This means huge support for:
Solar
Wind
Hydropower
Green hydrogen
Big players like NTPC, Adani Green, Tata Power, and ReNew Power are investing billions in clean energy. The budget also offers tax breaks, low-interest loans, and faster clearances.
✅ 3. PLI Scheme: Game-Changer for Power Equipment
PLI (Production Linked Incentive) is a government scheme that gives incentives to manufacturers based on their output.
In the power sector, PLI is being used for:
Solar panel/module manufacturing
Advanced battery storage
EV charging infrastructure
Smart meters and grid tech
This means companies making power equipment within India get rewarded — boosting domestic manufacturing and exports.
Examples of PLI Winners:
Tata Power Solar
Waaree Energies
Servotech Power
Amara Raja Energy
Exide Industries (battery PLI)
✅ 4. Modernization of Grid & Infrastructure
India’s power infrastructure is being upgraded and digitized.
Smart meters replacing old meters
Smart grids to manage load more efficiently
Underground cables, better transmission
PSUs like Power Grid Corporation, REC Ltd, and NHPC are leading this transformation. These upgrades improve efficiency, reduce loss, and bring more reliability.
✅ 5. EV Revolution = New Opportunity
Electric vehicles are the future. Every EV needs:
A charging station
Stable power supply
Smart grid support
So companies setting up EV charging infra (like Servotech, Tata Power, NTPC) are seeing new business models emerge. This link between mobility and energy is a major opportunity.
✅ 6. Private + PSU Partnership Model
Unlike the past, today’s power ecosystem sees collaboration between private players and PSUs. For example:
NTPC and Indian Oil working on hydrogen
Tata Power partnering with states for solar rooftops
Servotech tying up with PSUs for EV charging
This reduces risk, increases scale, and boosts trust for investors.How to Understand Different Power Stocks
🔌 Generation Stocks:
These companies produce electricity.
NTPC (thermal + renewable)
NHPC (hydropower)
SJVN (solar, hydro)
Adani Green (solar, wind)
⚡ Transmission & Distribution Stocks:
They carry electricity from plants to homes/factories.
Power Grid Corporation
Torrent Power
Tata Power
🔋 Equipment & Infra Stocks:
They make batteries, inverters, smart meters, charging stations
Servotech Power
Amara Raja Energy
Exide Industries
Hitachi Energy India
📈 Trading Strategies for Power Stocks
🛠️ For Swing Traders:
Watch for breakouts from consolidation patterns
Use indicators like volume + RSI divergence for entry
Example: Servotech consolidates for 3–5 days → breakout candle + high volume = entry
💼 For Long-Term Investors:
Pick companies with:
Consistent revenue/profit growth
Low debt
Green energy roadmap
SIP into leaders like NTPC, Tata Power, Power Grid
🔁 For Momentum Traders:
Use sector rotation charts (Nifty Energy Index)
Trade around policy news, budget updates, energy shortages, or global oil price moves
Outlook for 2025–2030
India’s power sector is not just about keeping lights on anymore. It’s about:
Powering a digital, electric, and green economy
Becoming a global energy exporter
Creating jobs and wealth through Make in India
Here’s what we can expect in coming years:
Massive growth in battery storage capacity
Rooftop solar + net metering in most cities
Hydrogen-based vehicles and fuel stations
India becoming a solar module export hub
In simple words: The power sector of tomorrow is smart, clean, connected — and investable.
✅ Final Thoughts
The Power & Utilities sector in 2025 is at a tipping point — supported by government policy, modern tech, global ESG demand, and rising consumption. It’s no longer “boring” or “slow.”
Whether it’s green energy leaders like Tata Power, efficient PSUs like NTPC, or disruptors like Servotech — this space is full of opportunity
IPO & SME Buzz📈 Why Are IPOs Booming in 2025?
Let’s understand what’s fuelling this mega wave:
✅ 1. Strong Market Sentiment
Both Nifty and Sensex are near all-time highs
Retail, FII, and mutual fund participation is rising
This bullishness is driving interest in new listings
✅ 2. Favorable Regulatory Environment
SEBI has streamlined IPO processes
Faster listing timelines (T+3 now), better SME disclosures
Attracting more genuine companies to go public
✅ 3. Retail Investor Explosion
Retail investors have grown from 4 crore to 12 crore+ in 3 years
Most IPOs are oversubscribed in the retail segment
Apps like Zerodha, Groww, Upstox have made IPO investing super easy
✅ 4. SMEs Want Capital + Visibility
SMEs are looking to raise capital for expansion, not just survival
Going public builds brand trust, creditworthiness, and long-term valuation
Also helps in professionalizing business operations
✅ 5. High Listing Gains = FOMO
Many IPOs (especially SME) are opening with 100%–500% premiums
This creates a rush — people apply hoping for quick profits
🚀 SME IPOs: The Real Game Changer
What is an SME IPO?
SME IPOs are for smaller companies (typically with ₹10–250 crore market cap), listed on:
NSE Emerge
BSE SME
These platforms are designed for high-growth businesses in manufacturing, IT, textiles, agriculture, infra, and other emerging sectors.
Why are SME IPOs buzzing?
Low valuation entries (IPO price ₹10–₹150 range)
Limited retail quota (35%) = quick oversubscription
Thin float (less available shares) = strong price movement
High retail interest, often driven by buzz on social media and brokers
Pros of SME IPOs:
Multibagger potential
Early entry into high-growth businesses
Often undervalued compared to mainboard peers
Cons of SME IPOs:
Low liquidity post-listing
Price volatility is high
Promoter quality needs deeper due diligence
Some may be “pump and dump” type plays
🧠 Should You Apply for IPOs?
Here’s how to decide whether an IPO is worth applying to:
🔍 Key Factors to Consider
Company Fundamentals
Revenue, profit trend, debt levels, ROE, margins
Business model — is it scalable?
Promoter Background
Are promoters credible? Any fraud history?
Prior experience and educational background
Valuation
Is it overvalued compared to listed peers?
Use P/E, P/B, EV/EBITDA ratios
IPO Objectives
Is the money being used for business growth?
Or just for promoter exit?
Grey Market Premium (GMP)
While unofficial, GMP shows listing expectations
Be cautious though — GMPs can be manipulated
🧾 How to Apply for an IPO (Step-by-Step)
🛠️ Through UPI-enabled Broker Apps (Zerodha, Groww, etc.)
Go to IPO section
Select IPO > Enter lot size (1 lot = 100 shares typically)
Enter UPI ID > Submit
Accept mandate in UPI app (PhonePe/Google Pay)
Wait for allotment (T+3 now, earlier T+6)
💡 Pro Tip:
Use multiple demat accounts (self, spouse, family) to increase allotment chances in oversubscribed issues.
🧾 What if You Don’t Get Allotment?
Don’t worry! You can:
Buy from listing day (at open or on dips)
Track stocks for post-IPO corrections (good entries happen 1–3 months later)
Use SME listing trends to plan swing trades
📊 Technical Strategy for IPO Traders
Gap Up Listings: Wait 5–15 mins post open → enter on pullback or breakout
F&O stocks: Use option straddle/strangle around listing day for volatility
SME IPOs: Watch for delivery volume, UC/LC hits, and media chatter
🧭 What’s Next for IPOs in 2025?
The pipeline remains very strong.
Upcoming Big IPOs:
PharmEasy (health tech)
Ola Electric (EV leader)
MobiKwik (fintech)
Navi Finserv (Sachin Bansal-backed)
Snapdeal (retail comeback)
Also, dozens of SMEs across states like Gujarat, Maharashtra, Rajasthan are planning listings in Q3–Q4 2025.
SEBI is also working to merge SME IPOs to mainboard faster, which could give early investors big rewards.
✍️ Final Thoughts
The IPO and SME buzz in 2025 is not just hype — it’s a real wealth-building opportunity for informed investors.
Yes, some IPOs are risky.
Yes, some are overhyped.
But the ones with good businesses, honest promoters, and solid demand are delivering massive returns.
This trend is part of a larger India story — where startups, manufacturers, tech firms, and SMEs are finally getting the capital and visibility they deserve
Institution Option Trading🔍 What Are Options?
Options are financial contracts that give you the right, but not the obligation, to buy or sell an asset at a specific price within a set time. There are two types:
Call Options – Right to buy
Put Options – Right to sell
Institutions use these tools not for speculation but for hedging, portfolio insurance, income strategies, and market positioning.
🧠 How Institutions Trade Options Differently
1. Multi-Leg Strategies
Institutions use advanced strategies like:
Covered Calls
Iron Condors
Vertical Spreads
Calendar Spreads
These strategies allow them to generate income and control risk, unlike directional bets most retail traders make.
2. Risk Management Focus
Institutions never “go all in.” They manage risk using:
Delta-neutral positioning
Hedging with opposite positions
Dynamic rebalancing
Volatility-based exposure control
They measure every trade based on risk-reward, not hope or prediction.
3. Understanding Option Greeks
Institutions actively monitor:
Delta (directional exposure)
Gamma (sensitivity to price change)
Theta (time decay)
Vega (volatility impact)
They use this to manage trades like professionals and adjust positions based on market conditions.
4. Implied Volatility & Volume Triggers
They don’t chase options with hype — they analyze:
Open interest spikes
Volatility crush or expansion
Skew analysis
These help detect big moves before they happen.
5. Smart Money Flow Tracking
Institutional traders leave footprints. You can learn to track:
Block trades
Unusual options activity
Dark pool activity
This reveals where big money is being placed — giving you a serious trading edge.
🎯 What You’ll Learn in Institutional Option Trading
Institutional mindset and objective-driven trading
How to trade options with structure and clarity
How to use Greeks for trade management
Institutional strategies vs. retail mistakes
Real-world case studies from option chain data
👨🏫 Who Is This For?
Traders who want to learn professional-grade options trading
Retail traders looking to stop losses and build consistency
Intermediate traders who want to move beyond basic buying
Investors looking to hedge or enhance returns with options
✅ Final Thoughts
Institutional Option Trading is not about quick profits — it's about risk-managed, high-probability trading with purpose. By learning how institutions trade options, you can elevate your trading game, improve consistency, and avoid emotional mistakes.
OHLC Monthly Magic🎯 Simple but Powerful Trading Concept – No Indicators, No Patterns Needed!
Dear viewers,
Today, I'm sharing something so simple that most traders completely overlook it. While everyone else is busy complicating trading with fancy indicators, patterns, and strategies — I want to take you back to the basics that actually work.
✅ I’m using a Nifty chart to explain this. I’ve highlighted the previous month’s candle, and using the drawing tool’s magnet mode, I’ve plotted simple horizontal lines at the:
• Open
• High
• Low
• Close
📊 That’s it! No indicators. No patterns. Just price action from the previous month.
Now, switch to the Weekly or Daily timeframe and observe what happens around those levels. You’ll see clear supply and demand zones forming — automatically. These are the real institutional levels where price reacts strongly.
🔒 Who Should Use This?
If you're a retail trader, I do not recommend getting into intraday or index options — they are high-risk and emotionally draining, especially for beginners.
However, if you're an experienced trader and can handle the volatility, here’s how you can use this method powerfully:
📅 After marking the previous month’s OHLC levels:
• Move to the current month
• Watch how price interacts with those levels
• Combine this with RSI for extra confirmation:
📈 RSI + OHLC = High-Probability Zones
• If RSI > 60 and price is nearing the previous high — there's an 80-90% chance of a breakout.
• If RSI < 40 and price is near the previous low — expect further downside.
• We ignore the 40–60 RSI range. It’s noise. We're only focused on strong bullish or bearish momentum.
✅ Try this on stocks, crypto, forex (EUR/USD) — anything.
Once you master this concept, you won’t need any fancy indicators or complicated supply-demand theories. Just price action and momentum will guide your trades.
Thanks for watching, and apply this to see the magic yourself. Check my previous post for deeper understanding of -
Positional Trading Setup
Swing Trading Setup
Stock Options Swing Setup
And - Investment Positional Trading Setup (coming soon)
Focus on which is simple. God Blesses you All!
Faraaz T
Sr. Exec. Research Analyst - Equity
Stockholm Securities - UK
FMCG & ConsumptionThink about your daily life — the toothpaste you use, the biscuits you eat, the shampoo you prefer, the tea you drink, the food delivery app you order from. Every one of these touches a part of the FMCG & consumption sector.
Now multiply that by 1.4 billion Indians, and you realize the size of this engine.
In 2025, the FMCG (Fast-Moving Consumer Goods) and consumption-driven stocks are at the center of a powerful story — one shaped by:
India's rising middle class
Rural income revival
Urban premiumization
Growth of e-commerce and quick commerce
Digital payments & new-age D2C (Direct-to-Consumer) brands
This isn't just a theme — it's a structural growth trend that never goes out of fashion.
Let’s break it down step-by-step.
🧼 What is FMCG & Consumption Sector?
FMCG stands for Fast-Moving Consumer Goods. These are everyday products people buy frequently:
Food & beverages (biscuits, noodles, soft drinks, snacks)
Personal care (soap, shampoo, deodorant)
Household items (detergent, floor cleaner, toothpaste)
Over-the-counter (OTC) products (balms, cough syrup, nutrition)
The Consumption theme expands on this to include:
Retail (organized & unorganized)
Quick commerce (Blinkit, Zepto)
E-commerce (Amazon, Flipkart, Nykaa)
Food delivery (Zomato, Swiggy)
Apparel & footwear (Trent, Aditya Birla Fashion)
Durables & electronics (TVs, fridges, fans, phones)
So whether it’s Maggi or Myntra, Parle-G or Paytm Mall — it all fits under Consumption.
🔥 Why FMCG & Consumption Is Trending in 2025
Let’s look at what’s driving this sector today:
1️⃣ Rural Demand Is Rebounding
After 2 years of low rural growth due to inflation and erratic monsoons, 2025 has brought strong crop output, stable agri prices, and more cash in hand.
Rural India forms over 40% of FMCG consumption, especially:
Entry-level soaps, snacks, tea
Sachet products
Local brands
Companies like Dabur, HUL, Marico, and Emami have all confirmed rural growth is picking up fast.
2️⃣ Premium Urban Consumption Is Booming
At the same time, India’s cities are upgrading:
Tier-2 cities now demand premium face creams, health foods, organic juices
Young consumers are choosing branded wear, subscription boxes, and gourmet snacks
Working women are driving personal care product sales
Urban India is moving from price to value, and that’s a goldmine for consumer brands.
3️⃣ Quick Commerce Is Changing Habits
Apps like Blinkit, Zepto, Swiggy Instamart are:
Delivering goods in 10–20 minutes
Creating new demand cycles (midnight snacking, impulse buys)
Becoming a new channel for FMCG sales
For FMCG companies, this means higher turnover and visibility, especially for smaller SKUs (sachets, ₹5/₹10 packs).
4️⃣ Direct-to-Consumer (D2C) Boom
New-age startups like:
Mamaearth (beauty, baby care)
WOW Skin Science (natural shampoos)
BoAt (audio & smart accessories)
Licious (fresh meats)
…are bypassing traditional stores and selling directly online.
This model:
Cuts middlemen
Boosts margins
Creates brand intimacy
And now many of these brands are listed or IPO-ready, adding fire to the consumption story.
5️⃣ China+1 & Make in India Push
Many global companies now manufacture in India, not China:
Personal care
Cosmetics
Packaged foods
This reduces costs, improves supply chains, and boosts exports of Indian FMCG brands too.
📈 Stock Market Performance (2023–2025)
Let’s take a look at how some top names have performed:
Stock Jan 2023 Price July 2025 Price Return
ITC ₹340 ₹460+ 35%
Hindustan Unilever ₹2,500 ₹2,800+ 12%
Dabur ₹550 ₹675+ 22%
Nestle India ₹18,000 ₹24,000+ 33%
Zomato ₹55 ₹195+ 250%+
Nykaa ₹120 ₹180+ 50%
Mamaearth (Honasa) ₹320 (IPO) ₹460+ 44%
Quick commerce, D2C and food delivery stocks have been top gainers.
Traditional FMCG majors are more slow & steady compounders.
🛒 Segments Inside FMCG & Consumption
Let’s divide this into sub-themes:
🍪 1. Packaged Foods & Beverages
Britannia (biscuits)
Nestle India (Maggi, chocolates)
Tata Consumer (tea, coffee, salt)
Varun Beverages (Pepsi bottling)
Bikaji, Prataap Snacks (local snacks)
🧼 2. Personal & Household Care
HUL (Dove, Surf Excel, Lifebuoy)
Dabur (Chyawanprash, Vatika)
Marico (Parachute, Saffola)
Godrej Consumer (Goodknight, Cinthol)
Emami (Fair & Handsome, Navratna)
🛍️ 3. Retail Chains & Apparel
Trent (Westside, Zudio)
V-Mart
Avenue Supermarts (D-Mart)
Aditya Birla Fashion (Pantaloons, Van Heusen)
Shoppers Stop
🍕 4. Online Food & Quick Commerce
Zomato
Jubilant Food (Domino’s)
Devyani International (KFC, Pizza Hut)
Zepto (IPO coming soon)
Blinkit (part of Zomato)
💄 5. Beauty & D2C Personal Care
Honasa (Mamaearth)
Nykaa
Lotus Herbals (Private)
WOW Skin Science (IPO Expected)
💡 Why Traders and Investors Love This Sector
✅ Always in Demand – Recession or boom, people still need soap and toothpaste.
✅ Strong Brand Power – Consumer loyalty = pricing power = margin stability.
✅ Low Capex Businesses – High return on capital, especially for asset-light D2C models.
✅ Growth via Premiumization – Indians are trading up from "cheap" to "value".
✅ Earnings Predictability – FMCG companies often beat or meet earnings estimates.
📊 How to Trade or Invest in This Theme
🎯 For Long-Term Investors:
Pick 3–4 companies across segments:
One traditional FMCG major (HUL, ITC)
One high-growth food player (Nestle, Varun Beverages)
One retail/delivery stock (Zomato, Trent)
One new-age D2C story (Mamaearth, Nykaa)
Hold for 3–5 years. These stocks are slow compounders with low risk + decent reward.
📉 For Traders:
Look for volume breakouts after consolidation
Track monthly updates on rural/urban growth
Trade around quarterly results and guidance
Use options strategy around earnings for volatility plays (like Zomato)
⚠️ Risks to Watch Out For
Risk Explanation
Inflation Pressure Higher input costs (milk, palm oil) hurt margins
Valuation Concerns Some D2C stocks may be overpriced
Competition from Local Players Especially in rural and Tier-3 cities
Dependency on Monsoon A weak monsoon can dent rural demand
🚀 The Road Ahead (2025–2030)
India is expected to:
Add 250 million middle-class consumers by 2030
See online retail double in size
Witness over 500 million people shop on mobile phones
Grow FMCG exports to Asia & Africa
The Indian consumption engine is just starting up. This isn't a temporary trend — it’s a secular, multi-decade opportunity.
✅ Conclusion
The FMCG & consumption story in India is:
Stable during slowdowns
Explosive during booms
Universal in reach — touching every home, city, and village
Now evolving rapidly with D2C, quick commerce, and premiumization
Whether you're an investor looking for consistent compounding or a trader looking for smart momentum plays, this is one of the most powerful sectors to focus on in 2025 and beyond
Difference Between Technical Analysis and Option Chain Analysis✅ 1. What is Technical Analysis?
Technical Analysis (TA) is the art and science of predicting future price movements based on historical price and volume data.
It’s like checking a stock’s past behavior on a chart to guess what it might do next.
🧠 How Does It Work?
Uses charts (candlestick, line, bar)
Studies patterns (head and shoulders, cup & handle, flags, etc.)
Applies indicators (RSI, MACD, Moving Averages, Bollinger Bands)
Identifies support & resistance levels
Helps time entry and exit points
📊 What Does It Tell You?
Is the stock trending up or down?
Is it overbought or oversold?
Where are strong support/resistance zones?
Is a breakout or breakdown happening?
🧰 Tools Used in Technical Analysis:
TradingView, Chartink, Zerodha Kite, Upstox Pro, etc.
Indicators: RSI, MACD, EMA, VWAP, Supertrend
Patterns: Breakout, Double Top, Flag Pattern, etc.
✅ 2. What is Option Chain Analysis?
Option Chain Analysis is specific to derivatives trading. It looks at open interest (OI), premiums, and strike prices to understand what option traders are betting on.
It helps you decode the behavior of big players (institutions) in the options market — especially on indices like Nifty, Bank Nifty or liquid stocks like Reliance, HDFC Bank, etc.
🧠 How Does It Work?
An option chain shows all available strike prices and their:
Call (CE) and Put (PE) premiums
Open Interest (OI) — how many contracts are outstanding
Changes in OI — fresh buying/selling activity
Volume traded
Implied Volatility (IV) — market’s expectations of volatility
📊 What Does It Tell You?
Where is the market expecting resistance? (High Call OI = resistance)
Where is the market expecting support? (High Put OI = support)
What are option writers (big players) doing?
Is the market bullish, bearish, or neutral?
🧰 Tools Used in Option Chain Analysis:
NSE Website (Option Chain)
Sensibull, Opstra, QuantsApp, StockMock
Open Interest Analysis Tools
PCR (Put Call Ratio)
Max Pain Theory
⚖️ Key Differences: Technical Analysis vs Option Chain Analysis
Feature Technical Analysis Option Chain Analysis
Used For Any stock, index, or crypto Only in derivatives (Options)
Data Based On Price, volume, chart patterns OI, strike prices, premiums, IV
Who Uses It? All traders (equity, F&O, forex, crypto) Mostly F&O traders and option
Time Horizon Intraday to long-term Intraday to expiry-based
📌 Practical Example (Nifty)
🔍 Technical View:
Nifty is making higher highs, higher lows
RSI = 60 → Momentum is still strong
20 EMA is acting as support
➡️ Suggests bullish trend — buy on dips
📈 Option Chain View:
Highest Call OI at 24,000 → Strong resistance
Highest Put OI at 23,500 → Strong support
Put writing increasing at 23,600 → Bulls defending this level
➡️ Suggests market may stay between 23,500–24,000
🎯 When to Use Which?
Situation Use This
Want to analyze a stock's trend Technical Analysis
Trading non-derivativ e stocks Technical Analysis
Intraday scalping Both (TA + OI levels)
Trading Nifty/Bank Nifty Options Option Chain Analysis
Looking for expiry range predictions Option Chain
Want to confirm breakout strength Combine both!
💡 Best Strategy: Combine Both!
Professional traders don’t treat these as either-or.
They often use:
📉 Technical analysis to find chart setups
🧠 Option chain data to confirm big player positions
Example:
A breakout on chart + strong Put OI at breakout level = high-probability trade.
✅ Summary
Aspect Technical Analysis Option Chain Analysis
Based on Charts, price, volume OI, premiums, strike data
Used for All trading instruments Only options
Helps in Timing trades, spotting patterns Predicting expiry range
Tools RSI, MACD, Patterns, EMAs OI, IV, Max Pain, PCR
Users Retail + institutional traders Mainly option traders, F&O players
🚀 Final Thought
Both tools are powerful in their own right. But when used together, they give you a 360° edge in the markets.
Technical analysis shows you what's happening on the chart.
Option chain analysis shows you what traders expect to happen behind the scenes.
Mastering both is the true trader’s advantage
Define Option Chain✅ Definition of Option Chain (Explained Simply)
An Option Chain is a table or list that shows all available option contracts (Calls and Puts) for a particular stock or index — along with key data like strike prices, premiums, open interest, and more.
It helps option traders quickly analyze where the market expects the stock or index to move, reverse, or stay range-bound.
📘 In Simple Terms:
An option chain is like a scoreboard of what traders are betting on — whether prices will go up or down, and at what level.
🧩 What Does an Option Chain Show?
An option chain is divided into two parts:
Call Options (CE) 🔵Strike Price Put Options (PE) 🔴
Each row in the option chain represents:
A specific strike price
Its call and put premiums
Open interest (OI) — number of contracts open
Change in OI — fresh buying/selling activity
Volume — how many contracts traded
Implied Volatility (IV) — market’s expected volatility
🧠 Key Terms in Option Chain (Explained Simply)
Term Meaning in Easy Words
Strike Price The price at which you can buy/sell the underlying asset
Call Option (CE) Bets the price will go up
Put Option (PE) Bets the price will go down
Premium The price you pay for buying 1 option
Open Interest (OI) How many contracts are currently open
Change in OI How many contracts were added or closed today
Volume Number of contracts traded today
IV (Implied Volatility) Market’s prediction of future price fluctuation
📊 What You Can Learn From It:
Where traders expect support (high Put OI zones)
Where traders expect resistance (high Call OI zones)
Which strikes are seeing new buying/selling activity
Possible expiry range (Max Pain level)
📍 Example (Bank Nifty Option Chain Sample):
CE (Call Options) Strike PE (Put Options)
OI: 5.2 lakh 49,000 OI: 6.1 lakh
OI: 8.4 lakh 🟩 49,500 OI: 10.3 lakh 🟥
OI: 12.1 lakh ✅ 50,000 OI: 9.5 lakh
✅ Highest Call OI = 50,000 → Resistance
✅ Highest Put OI = 49,500 → Support
➡️ So, market may stay between 49,500 and 50,000 for now
🧠 Why Option Chain Matters for Traders:
Helps spot support/resistance without charts
Identifies where big institutions are writing options
Assists in building option strategies (like Iron Condor, Straddles)
Key for expiry day (Thursday) trades
✅ Summary:
Option Chain Is... Option Chain Helps You...
A table of all calls & puts Find support & resistance from OI levels
Loaded with strike-wise data See where traders are buying/selling most
Used in options trading Predict expiry range & big player activity
What is FII and DII✅ What is FII and DII?
These are two major types of investors who invest huge amounts of money in the Indian stock market.
Acronym Full Form Meaning
FII Foreign Institutional Investor Big investors from outside India
DII Domestic Institutional Investor Big investors within India
🧠 Let’s Understand Them One by One:
🔵 FII – Foreign Institutional Investor
These are large investment firms, hedge funds, mutual funds, pension funds, insurance companies, etc. from outside India.
They invest in Indian equity markets, debt markets, bonds, etc.
Registered with SEBI to invest in Indian markets
📌 Examples:
Morgan Stanley
BlackRock
Goldman Sachs
Vanguard
JP Morgan Asset Management
🎯 Why They Invest in India?
Growth opportunity in Indian economy
Higher returns compared to developed markets
Long-term story of India = bullish
🔥 When FII inflow increases:
Nifty, Sensex, Bank Nifty usually go up
Especially impacts large-cap stocks (Reliance, HDFC, ICICI Bank)
🔴 DII – Domestic Institutional Investor
These are big Indian institutions that invest in Indian markets.
Includes:
Mutual Funds (like SBI MF, ICICI Pru MF)
Insurance companies (LIC, HDFC Life)
Banks (SBI, HDFC Bank treasury)
Pension funds (EPFO)
📌 They manage common people's money, and invest in:
Equity (stocks)
Debt (bonds, government securities)
🎯 Why DIIs Matter?
Provide stability to markets
When FIIs sell, DIIs often support the market by buying
📊 FII vs DII - Key Differences
Factor FII DII
Based I Foreign Countries India
Regulated By SEBI SEBI
Invest In Equity, Bonds, Derivatives Equity, Bonds, Mutual Funds
Impact On Market Highly volatile, quick to enter/exit More stable, long-term investing
Popular Examples BlackRock, JP Morgan, Nomura LIC, SBI Mutual Fund, ICICI Pru MF
🧭 Why Traders Watch FII/DII Data Daily
📈 FII/DII Activity Shows Market Mood
When FIIs are buying, markets often trend up
When FIIs are selling, markets can become volatile
When DIIs are buying, they may be supporting the market
Example:
"FII bought ₹2,500 Cr, DII sold ₹500 Cr"
→ Strong bullish sign, smart money is entering
🔄 What Happens When FIIs Sell and DIIs Buy?
FIIs sell during global tension or USD strength (they pull out money)
DIIs buy at dips to average out long-term positions
This creates volatility but also buying opportunities
🧠 Final Thoughts
FII = Foreign money → fast movers, sensitive to global news
DII = Indian money → stable investors, long-term focused
Daily FII/DII data tells us where smart money is flowing
📌 Smart traders always check FII/DII data before taking major trades — especially in Nifty, Bank Nifty, Reliance, Infosys, HDFC twins
Swing Trading - Stock Options - Setup CE/PE🔥 Stock Options Trading Strategy – Built on Core Swing/Positional Principles (85% Win Rate Setup)
As a continuation of my last post on Swing and Positional Trading Setup with 85% Win Rate, I’m now sharing a Stock Options Trading Concept that follows the same core principles but is tailored specifically for liquid stock options.
You’ve already been provided with a list of 100+ high-beta, liquid stocks. For this strategy, you will strictly focus only on those stocks.
✅ Strategy Setup
🔹 Timeframe Filters:
• Monthly RSI > 60 (RSI has crossed and is holding above 60)
• Weekly RSI > 60 (same condition as above)
• Daily RSI: RSI must be crossing 60 or on the verge of crossing
Now, on the Daily Chart, mark the current swing high and swing low.
📌 Two Entry Approaches:
Approach 1: Breakout Entry
• Entry: When swing high is broken.
• Stop Loss (SL): Swing low or previous week’s low.
Approach 2: Pullback Entry
• Wait for a retracement from swing high (should not exceed 50% retracement).
• Confirmation of pullback weakness: Volume bars should be shrinking/decreasing.
• Entry: On breakout of the last candle high of the pullback.
• Stop Loss: Swing low or previous week’s low.
Once in the trade, trail your stop loss to cost after 3 consecutive bullish candles.
📤 Exit Rules
• Exit the Stock Options position only if the Daily RSI drops below 60.
⚠️ Important Guidelines for Stock Options
• 💡 Trade with only 1 lot. Never exceed your lot size.
• 📅 Enter after 2 days of the monthly expiry and exit before 2 days of next monthly expiry to avoid smart money manipulation.
• 🎯 Choose strike prices in multiples of 25, 50, 75, or 100 for better liquidity.
• Example: If stock is at 1564, choose 1550 ITM or 1575 ATM.
• ⏱️ For quick exits, always place exit orders at round numbers like 5 or 10 levels.
• Example: If you entered at ₹70 and the option is at ₹144, place an exit at ₹140 or ₹145—not any random price.
For PE buying-
Monthly RSI < 40
Weekly RSI < 40
Daily RSi crossing 40 or below
Same process for PE with 2 approach as you like but in reverse form.
🧠 Final Thoughts
Stick to this simple, structured setup. Don’t complicate it.
✅ Backtest thoroughly
✅ Understand each setup
✅ Plan your trades BEFORE entering, never after.
Let the market come to you—don’t chase it.
Disclaimer -
These posts are only to educate you all. You are responsible for the actions you take. Consult your advisor if you need. I am a Sr. Research Analyst in Equity Firm BUT not yet SEBI reg.
High Beta Stock List for Options-
🚗 Auto
• Bajaj Auto
• Bosch Ltd
• Eicher Motors
• Hero Motocorp
• Maruti Suzuki
• TVS Motors
• Tata Motors
🏦 Banking & Financial Services
• Bank of Baroda
• Kotak Mahindra Bank
• Axis Bank
• ICICI Bank
• HDFC Bank
• IndusInd Bank
• Bajaj Finserv
• Bajaj Finance
• SBI
🧪 Chemicals
• Aarti Industries
• Atul Ltd
• Navin Fluorine
• UPL
• Tata Chemicals
🍫 FMCG
• Britannia Industries
• Godrej Consumer
• Tata Consumer
• DMart
• Hindustan Unilever
• Dabur
💊 Pharma & Healthcare
• Apollo Hospitals
• Alkem Labs
• Biocon
• Divis Labs
• Dr. Reddy’s
• IPCA Labs
• Laurus Labs
• Lupin
• Aurobindo Pharma
• Sun Pharma
• Cipla
💻 IT Sector
• HCL Technologies
• Infosys
• LTIMindtree
• TCS
• Tech Mahindra
• Wipro
⛓️ Steel & Metals
• APL Apollo Tubes
• JSW Steel
• Jindal Steel
• Tata Steel
• Hindalco
• L&T
🛢️ Oil & Gas
• Reliance Industries
• Gujarat Gas
• Indraprastha Gas (IGL)
• Mahanagar Gas (MGL)
• Tata Power
🏢 Realty
• DLF Ltd
• Godrej Properties
• Lodha (Macrotech Developers)
• Oberoi Realty
• Phoenix Mills
🛋️ Durables & Others
• Sona BLW (Sona Comstar)
• Amber Enterprises
• Bata India
• Crompton Greaves
• Dixon Technologies
• Titan Company
• ACC Cement
• Ambuja Cement
• Ultratech Cement
• Voltas Ltd
• Polycab India
• Mazagon Dock (Mazdock)
• Asian Paints
• Berger Paints
Cummins
LEARN INSTITUTIONAL TRADING🔍 What Is Institutional Trading?
Institutional trading is how large financial organizations operate in the markets. They don’t buy based on tips or random indicators — they use price action, volume data, liquidity zones, and market structure to accumulate and distribute positions quietly, often without the retail crowd noticing.
Learning institutional trading means learning:
How markets truly move
How smart money traps retail traders
How to follow big money footprints
🧠 Key Concepts You’ll Learn
1. Market Structure Mastery
Understand how institutions analyze market structure:
Break of Structure (BoS)
Change of Character (ChoCH)
Trends, ranges, and consolidation zones
2. Liquidity and Order Blocks
Learn how to identify:
Institutional order blocks (entry zones of banks)
Liquidity grabs (stop loss hunting zones)
Fair value gaps and imbalance areas
3. Smart Money Concepts (SMC)
SMC is the foundation of institutional trading. You’ll learn:
Wyckoff accumulation & distribution
Internal vs. external market structure
Entries based on premium-discount theory
4. Volume and Manipulation
Learn how volume, price action, and timeframes work together to show:
Hidden buying/selling
Trap zones
Institutional accumulation patterns
5. Entry & Exit Planning
How institutions plan:
Low-risk, high-reward entries
Multi-timeframe confirmation
Managing trades with scaling in/out
📊 Why Institutional Trading Is Powerful
Institutions:
Have deep capital
Move the market
Use strategies based on logic and patience
When you learn how to think like an institution, you stop chasing signals and start trading with confidence and structure.
👨🏫 Who Should Learn Institutional Trading?
Beginners looking for the right trading foundation
Intermediate traders tired of inconsistent results
Advanced traders seeking deeper strategy and psychology
Intraday, swing, and positional traders
✅ What You'll Gain:
A complete mindset shift in how you view the markets
Strategies with clear entry, stop loss, and target rules
Tools to trade any market: stocks, forex, indices, crypto
Confidence to follow smart money — not get trapped by it
🚀 Start Your Journey Now
Stop trading like the 90%. Learn how the 10% think, plan, and profit.
"Learn Institutional Trading" is your opportunity to elevate your market skills and build long-term trading success with a professional edge.
Swing Trading Stock Options - High Momentum Strategy🔥 Stock Options Trading Strategy – Built on Core Swing/Positional Principles (85% Win Rate Setup) -
As a continuation of my last post on Swing and Positional Trading Setup with 85% Win Rate, I’m now sharing a Stock Options Trading Concept that follows the same core principles but is tailored specifically for liquid stock options.
You’ve already been provided with a list of 100+ high-beta, liquid stocks. For this strategy, you will strictly focus only on those stocks.
✅ Strategy Setup
🔹 Timeframe Filters:
• Monthly RSI > 60 (RSI has crossed and is holding above 60)
• Weekly RSI > 60 (same condition as above)
• Daily RSI: RSI must be crossing 60 or on the verge of crossing
Now, on the Daily Chart, mark the current swing high and swing low.
📌 Two Entry Approaches:
Approach 1: Breakout Entry
• Entry: When swing high is broken.
• Stop Loss (SL): Swing low or previous week’s low.
Approach 2: Pullback Entry
• Wait for a retracement from swing high (should not exceed 50% retracement).
• Confirmation of pullback weakness: Volume bars should be shrinking/decreasing.
• Entry: On breakout of the last candle high of the pullback.
• Stop Loss: Swing low or previous week’s low.
Once in the trade, trail your stop loss to cost after 3 consecutive bullish candles.
📤 Exit Rules
• Exit the Stock Options position only if the Daily RSI drops below 60.
⚠️ Important Guidelines for Stock Options
• 💡 Trade with only 1 lot. Never exceed your lot size.
• 📅 Enter after 2 days of the monthly expiry and exit before 2 days of next monthly expiry to avoid smart money manipulation.
• 🎯 Choose strike prices in multiples of 25, 50, 75, or 100 for better liquidity.
• Example: If stock is at 1564, choose 1550 ITM or 1575 ATM.
• ⏱️ For quick exits, always place exit orders at round numbers like 5 or 10 levels.
• Example: If you entered at ₹70 and the option is at ₹144, place an exit at ₹140 or ₹145—not any random price.
For PE buying-
Monthly RSI < 40
Weekly RSI < 40
Daily RSi crossing 40 or below
Same process for PE with 2 approach as you like but in reverse form.
🧠 Final Thoughts
Stick to this simple, structured setup. Don’t complicate it.
✅ Backtest thoroughly
✅ Understand each setup
✅ Plan your trades BEFORE entering, never after.
Let the market come to you—don’t chase it.
Disclaimer -
These posts are only to educate you all. You are responsible for the actions you take. Consult your advisor if you need. I am a Sr. Research Analyst in Equity Firm BUT not yet SEBI reg.
100+ Stocks List - High Beta -
🚗 Auto
• Bajaj Auto
• Bosch Ltd
• Eicher Motors
• Hero Motocorp
• Maruti Suzuki
• TVS Motors
• Tata Motors
🏦 Banking & Financial Services
• Bank of Baroda
• Kotak Mahindra Bank
• Axis Bank
• ICICI Bank
• HDFC Bank
• IndusInd Bank
• Bajaj Finserv
• Bajaj Finance
• SBI
🧪 Chemicals
• Aarti Industries
• Atul Ltd
• Navin Fluorine
• UPL
• Tata Chemicals
🍫 FMCG
• Britannia Industries
• Godrej Consumer
• Tata Consumer
• DMart
• Hindustan Unilever
• Dabur
💊 Pharma & Healthcare
• Apollo Hospitals
• Alkem Labs
• Biocon
• Divis Labs
• Dr. Reddy’s
• IPCA Labs
• Laurus Labs
• Lupin
• Aurobindo Pharma
• Sun Pharma
• Cipla
💻 IT Sector
• HCL Technologies
• Infosys
• LTIMindtree
• TCS
• Tech Mahindra
• Wipro
⛓️ Steel & Metals
• APL Apollo Tubes
• JSW Steel
• Jindal Steel
• Tata Steel
• Hindalco
• L&T
🛢️ Oil & Gas
• Reliance Industries
• Gujarat Gas
• Indraprastha Gas (IGL)
• Mahanagar Gas (MGL)
• Tata Power
🏢 Realty
• DLF Ltd
• Godrej Properties
• Lodha (Macrotech Developers)
• Oberoi Realty
• Phoenix Mills
🛋️ Durables & Others
• Sona BLW (Sona Comstar)
• Amber Enterprises
• Bata India
• Crompton Greaves
• Dixon Technologies
• Titan Company
• ACC Cement
• Ambuja Cement
• Ultratech Cement
• Voltas Ltd
• Polycab India
• Mazagon Dock (Mazdock)
• Asian Paints
• Berger Paints
Cummins
Best of luck. Comments if you have any doubts. God bless you all, be happy!
Faraaz T
Sr. Equity Research Analyst
Stockholm Securities - UK
Commodity Supercycle 2025: Metals & Energy⚒️ Metals: The Foundation of Industrial Growth
Why are metal prices booming?
Let’s break it down in human terms:
Massive Infrastructure Projects
India, US, China, and Europe are all spending billions on roads, bridges, railways, smart cities, and housing.
All of that needs steel, cement, aluminum, copper, etc.
Clean Energy = More Copper & Aluminum
Solar panels, EVs, and wind turbines need a lot more copper, lithium, and rare metals than conventional energy.
This creates a demand explosion for base metals.
Supply Chain Bottlenecks
Mines across the world (especially in Africa, Chile, and Australia) are facing labour shortages, political instability, or environmental restrictions.
Less mining = less supply = prices go up.
China’s Comeback
China is the largest consumer of metals globally.
After a slow period in 2022–23, it’s back with a stimulus to revive housing and infrastructure — adding massive demand pressure.
🔋 Energy: Fuel for the Supercycle
What’s happening in oil, gas, and coal?
Crude Oil Above $90/Barrel
Conflicts (Russia-Ukraine, Middle East) + OPEC production cuts = tight supply
Despite the push for renewables, the world still runs on oil for transport and manufacturing
Natural Gas Shortages in Europe/Asia
War-related disruptions in Russian supply have caused natural gas prices to skyrocket
LNG imports from the US and Qatar are booming — good for companies in that ecosystem
Coal Prices Rising Again
Despite climate goals, India, China, and others are still using coal for base power
Coal India and related PSUs have seen strong earnings due to volume demand + price support
🧾 How This Affects the Indian Market
India is both a major consumer and a growing exporter of various commodities.
Winners in the Supercycle:
1. Metal Stocks (Steel, Aluminum, Copper)
Company Why It’s Benefiting
Tata Steel Global presence + rising prices = higher margins
JSW Steel Export growth + capex-driven demand
Hindalco Aluminum giant + Novelis (US-based unit)
Hindustan Copper India’s only copper miner; global demand rising
2. Energy Stocks (Oil, Gas, Coal)
Company Why It’s Benefiting
ONGC Rising crude prices = stronger profitability
Oil India Smaller PSU with strong rally potential
Coal India Massive volumes, dividend, pricing power
Reliance Petrochemicals + oil refining benefits
3. Ancillary & Export-Based Stocks
Company Role in Supercycle
NMDC Supplies iron ore – key to steelmakers
MOIL Manganese supplier for steel industry
APL Apollo Tubes Beneficiary of infra + steel boom
Welspun Corp Pipes for oil & gas pipelines
📊 Real Performance: Numbers Don’t Lie
Let’s take a quick look at recent returns (approx. from Jan 2023 to July 2025):
Stock Price in Jan 2023 Price in July 2025 Approx % Gain
Tata Steel ₹110 ₹170+ 55%+
JSW Steel ₹690 ₹930+ 35%+
Hindalco ₹430 ₹675+ 55%+
Coal India ₹220 ₹450+ 100%+
ONGC ₹150 ₹270+ 80%+
These are fundamentally driven rallies — not pump-and-dump moves. That’s the beauty of supercycles.
📈 Technical Outlook in July 2025
Nifty Metal Index:
📌 Near all-time highs (~9,000+ zone)
📈 Trend: Strong bullish
🔁 Expect periodic corrections of 5–7%, but uptrend likely to continue
Nifty Energy Index:
📌 In a broad uptrend, thanks to Coal India, ONGC, Reliance
📈 Breakouts seen in power generation and refining stocks
🎯 Next resistance at 30,000+, support at 28,500
🧠 What Traders & Investors Should Do
🧭 For Traders:
Focus on volume breakouts in metal & energy stocks
Watch for sectoral momentum using indices like Nifty Metal, Nifty Energy
Use Futures & Options (F&O) strategies like:
Call buying on breakout confirmation
Bull call spreads in ONGC, Hindalco, Tata Steel
Short straddles for sideways phases in Coal India
📆 For Swing Traders:
Identify weekly breakout patterns (flags, cup & handle, triangle)
Use trailing SL and partial booking (these stocks move fast)
Best timeframe: 2–4 week swings, especially in trending names
💼 For Long-Term Investors:
Allocate 10–15% of your portfolio to core metal/energy stocks
Focus on low-debt, dividend-paying companies (e.g., Coal India, ONGC)
SIP or staggered entries work well in a volatile commodity cycle
Expect volatility — supercycles are not linear
❗ Risks & Cautions
Every rally has its risks. Here’s what to keep in mind:
Risk Impact
Global Recession Could reduce commodity demand globally
China Slowdown Big impact on copper/steel demand
Currency Volatility Affects import/export profitability
Policy Changes Carbon tax, ESG push may hurt coal/oil stocks
Overheating Stocks may correct 15–20% if valuations get stretched
Always use risk management — especially in leveraged trades.
🗺️ Global Supercycle Factors to Watch in 2025–26
🛢️ Crude oil production quotas (OPEC+ decisions)
🏗️ China’s stimulus on construction and EVs
🌱 ESG push: Will governments ban/restrict dirty fuels faster?
💹 US Fed rate cuts/inflation outlook (affects commodity pricing)
🧾 Mining policies in resource-rich countries (Africa, Latin America)
These global forces shape how long the current commodity upcycle will last.
✍️ Final Thoughts
The commodity supercycle in 2025 is real and being driven by multi-year global trends in infrastructure, energy transformation, and supply limitations. This is not just a short-term rally — it’s part of a structural shift.
If you’re a trader — this sector is offering sharp, trend-friendly price action.
If you’re an investor — this is your chance to ride secular growth in India’s industrial backbone.
💡 “When the world builds, commodities boom. And when that boom is real, wealth is created.”
PSU & Defence Stock Boom🏢 First, What Are PSU & Defence Stocks?
🔹 PSU Stocks
"PSU" stands for Public Sector Undertaking — companies where the Government of India holds a majority stake (more than 51%).
These companies operate in key sectors like:
Defence manufacturing
Railways
Energy (oil, gas, coal)
Power
Finance
Infrastructure
They have a long history of stability, but until recently, they were seen as slow-moving or inefficient.
🔹 Defence Stocks
These include companies that:
Make defence equipment (fighter jets, missiles, radars, warships)
Work with the Indian Armed Forces or export to global defence clients
Provide electronics, software, and parts for defence systems
In India, many defence companies are also PSUs, such as:
Bharat Electronics (BEL)
Hindustan Aeronautics (HAL)
Bharat Dynamics (BDL)
Mazagon Dock Shipbuilders
Cochin Shipyard
📈 Why Are PSU & Defence Stocks Booming in 2025?
Here are the main drivers behind this massive rally:
✅ 1. Make in India + Atmanirbhar Bharat (Self-Reliance)
The government wants India to become self-reliant in defence production, reducing dependency on imports.
Key points:
Ban on importing 450+ defence items that must now be made locally
Big push to increase defence exports
Support to Indian PSUs to ramp up production
Result: More contracts for Indian defence companies = higher revenues and profits.
✅ 2. Massive Order Books
Many PSU defence companies are sitting on huge order books, sometimes 5–7x their annual revenue.
Examples:
BEL: Order book of ₹65,000+ crore
HAL: Got ₹45,000+ crore order for fighter jets + helicopters
Mazagon Dock: Building submarines and destroyers for Navy
Bharat Dynamics: Orders for missiles, torpedoes
The market loves visibility — and order books give confidence in future earnings.
✅ 3. Government Capex Boom
India’s Union Budget 2025 has focused heavily on:
Defence capex: ₹6 lakh crore+ earmarked for the military
Railways & infrastructure spending
Indigenisation of key technologies
This benefits PSU stocks like:
RVNL, IRCON, RITES (railway infra)
BEL, BDL, HAL (defence manufacturing)
BHEL, Cochin Shipyard (industrial & shipbuilding)
✅ 4. PSU Re-Rating + Efficient Management
For years, PSUs were seen as "government-run, slow, and inefficient."
But things have changed:
Better transparency
Higher dividend payouts
Restructuring of loss-making units
More professional management
Now, investors are re-rating these companies — giving them better valuations than before.
✅ 5. Retail & FII Interest
Retail investors are loving PSU stocks because:
Many trade below ₹100–300 levels (psychologically attractive)
High dividend yields (5–10%)
Visible government support
FIIs are entering because:
Valuations are still reasonable
These sectors have strong growth tailwinds
India is among the top 5 global defence spenders
✅ 6. Global Geopolitics
With rising global tensions (Russia-Ukraine, China-Taiwan), countries are increasing defence spending.
India is emerging as a credible exporter of:
Radars
Drones
Warships
Missiles
This has opened up global demand for Indian defence PSUs.
🧾 Real-World Success Stories
Let’s look at some stocks that delivered multibagger returns recently:
Stock Price (Jan 2023) Price (July 2025) Gain %
Mazagon Dock ₹450 ₹2,400+ 400%+
BEL ₹95 ₹320+ 230%+
HAL ₹1,100 ₹4,300+ 290%+
IRFC ₹25 ₹120+ 380%+
RVNL ₹30 ₹300+ 900%+
This is not just hype. These stocks rallied due to:
Strong earnings
Better efficiency
Clear government push
Long-term order visibility
📊 Technical Outlook (July 2025)
PSU Index (NSE PSU Bank + Infra):
At all-time highs
Weekly RSI: Strong, but near overbought (watch for healthy correction)
Trend: Bullish
Defence Stocks:
Many in stage 2 rally (post-consolidation breakout)
Delivery volumes high = institutional buying
F&O interest rising in BEL, HAL, IRFC
🔍 Best PSU & Defence Stocks to Watch (2025–26)
🚀 Defence PSU Leaders
Stock Why It's Hot
BEL Radar, electronics, missile systems, exports
HAL Fighter jets, helicopters, strong order book
BDL Missile maker, strategic tech player
Mazagon Dock Submarine, destroyers, Navy contracts
Cochin Shipyard Exports + defence orders
🛤️ Railway + Infra PSUs
Stock Why It’s Hot
IRFC Rail project financer, consistent income
RVNL Railway EPC projects, delivery volume spike
IRCON Infra + overseas rail projects
RITES Consultancy + export contracts
🔋 Power & Energy PSUs
Stock Sector Focus
BHEL Power infra, defence components
NTPC Renewable + base power growth
ONGC Oil exploration, dividend stock
🧠 Should You Invest Now?
✅ Pros:
Many PSU stocks still offer value despite big rally
Dividends are attractive (3%–8%)
Government is unlikely to reduce support before 2026 elections
Sector is in a long-term structural uptrend
❌ Risks to Consider:
Valuations may be overheated in some names
Any global peace news may reduce defence urgency
PSU stocks may correct if general market sentiment turns negative
Political uncertainty (pre-election) can cause temporary sell-off
📌 What’s the Strategy for Traders?
📅 Short-Term Traders:
Look for breakouts with high delivery volume
Ride trends on daily/weekly chart
Use trailing stop-loss to lock in profits
Don’t chase upper circuits blindly
🕰️ Swing Traders:
Focus on 3–5 week setups
Use support-resistance, trendlines, 50 EMA entries
Look for consolidation + breakout patterns (e.g. flags, cup-handle)
🪙 What’s the Strategy for Long-Term Investors?
Identify quality PSU stocks with high ROE, low debt, and strong order book
Enter on pullbacks or minor corrections
Hold for 2–5 years horizon
Reinvest dividends to build compounding returns
Don’t fall for “cheap but junk” stocks — quality matters
📚 Final Thoughts
The PSU & Defence Stock Boom of 2025 is driven by real, structural changes, not just hype.
India is becoming a global defence player, and PSU companies are finally being run like businesses — with efficiency, innovation, and profitability.
This rally may pause or cool off in between — but the multi-year story is far from over.
💡 "In a country that wants to defend itself, build itself, and grow itself — PSU & defence are the frontlines."
Banking & Financial Sector Near All-Time High in 2025 What Is the BFSI Sector?
BFSI stands for Banking, Financial Services, and Insurance. It includes:
Private and public sector banks (HDFC Bank, ICICI Bank, SBI, etc.)
NBFCs (Non-Banking Financial Companies) like Bajaj Finance, M&M Finance
Insurance companies like LIC, HDFC Life
Financial service firms like HDFC Ltd (pre-merger), IIFL, and brokers
Together, these companies form the backbone of India’s economy, handling everything from loans, credit cards, mutual funds, and insurance to rural financing and digital banking.
Current Market Position (July 2025)
Bank Nifty is trading above 54,000 – just below its all-time high of around 54,500+
Nifty Financial Services index is also hovering near its peak, led by strong performances from key stocks.
This means:
Banking stocks are leading the overall market rally.
Big money — from FIIs, mutual funds, and even retail — is flowing into BFSI.
Investors believe the sector will outperform in the upcoming quarters.
Why Is the Banking Sector So Strong Right Now?
1. Strong Earnings Growth
Most banks reported record profits in Q1 FY26
Examples:
HDFC Bank and ICICI Bank: Strong credit growth and low NPAs
SBI: Continued momentum in retail and agri-loans
Banks are making more money from both lending and investment services.
2. Improved Asset Quality (Low NPAs)
NPA = Non-Performing Asset (a loan that’s not being repaid)
In 2020–21, NPAs were a huge issue due to COVID.
Now in 2025, NPAs are at multi-year lows.
Better risk management + tech-based collections = fewer defaults.
This has improved investor confidence in banks.
3. Credit Demand Is Booming
India’s economy is growing at 7%+ GDP.
People are borrowing more:
For homes, education, business, and consumption
Corporates are also taking loans for:
Expansion, capex, and mergers
More loans = more interest income = better profits for banks and NBFCs.
4. Digital Banking Explosion
UPI, online lending, digital onboarding = huge cost savings
Banks like Kotak, ICICI, and SBI have aggressively expanded digital operations
NBFCs like Bajaj Finance and Paytm (financial arm) are leveraging tech to reach small towns
This is creating massive scale and reach with low overhead costs.
5. FII & DII Buying in Banking
Foreign Institutional Investors (FIIs) have returned in 2025
They prefer BFSI because it offers:
Liquidity
Consistent profits
Strong management
Domestic funds (DIIs and mutual funds) are also overweight on banking because it remains a core component of India’s growth engine.
Key Stocks Driving the Rally
🏛️ Private Banks
Stock Strength Points
HDFC Bank Post-merger synergy, retail + wholesale growth
ICICI Bank Best-in-class digital, strong balance sheet
Axis Bank Loan growth, improving CASA, strong NIM
Kotak Bank Conservative but profitable, strong capital base
IndusInd Bank Retail comeback, strong rural reach
🏦 Public Sector Banks (PSBs)
Stock Strength Points
SBI India’s biggest bank, strong rural and retail
Bank of Baroda Re-rating play, improved asset quality
Canara Bank PSU momentum + rising profitability
💳 NBFCs & Financial Services
Stock Focus Area
Bajaj Finance Consumer lending, digital
M&M Financial Rural auto + tractor finance
IIFL Finance Gold loan, home loan
🛡️ Insurance & AMC Stocks
Stock Focus
HDFC Life Long-term savings + insurance
SBI Life Market-linked insurance growth
LIC Recovery play post-IPO
Technical Picture: Bank Nifty (as of July 2025)
Resistance: 54,500 (All-time high zone)
Support levels: 53,300 and 52,700
Trend: Bullish (price above 20, 50, 200 EMA)
Volume: Rising, especially in HDFC, Axis, and SBI
Technical traders expect:
A breakout above 54,500 could take Bank Nifty to 56,000–57,000
A rejection might lead to healthy pullbacks before the next leg
What Traders Should Do
Intraday/Options Traders:
Focus on Bank Nifty index options on weekly expiry days (especially Thursdays)
Watch for breakout levels and OI build-up
Popular strategies:
Straddle at key resistance
Bull call spreads after breakout
Momentum scalping on ICICI, Axis, SBI
📆 Swing Traders:
Look for range breakouts on daily/weekly charts
Example: Entry on Axis Bank above ₹1,200 with SL at ₹1,160
Hold for 5–10% swing moves
🧾 What Long-Term Investors Should Do
✅ Continue SIPs in BFSI Mutual Funds
Most mutual funds (like SBI Bluechip, Axis Banking ETF) have high exposure to HDFC, ICICI, SBI, etc.
These are long-term wealth builders.
✅ Buy on Dips
If stocks fall 5–10% due to market-wide correction — it's often a buying opportunity, not panic time
Example: HDFC Bank falling from ₹1,800 to ₹1,650 is often bought by institutions
✅ Diversify within BFSI
Mix large-cap banks, PSU turnaround stories, and NBFCs for better returns with less risk
❌ Risks to Be Aware Of
Even though things look great, no rally comes without risks:
Risk Impact
Global Recession Could reduce FII flow
Rate Hikes (Globally) May reduce credit demand
Political Uncertainty 2026 elections might cause volatility
Asset Quality Shock If any hidden NPAs come up
Overvaluation in Mid NBFCs Some stocks may be overheated
💬 Expert Views
Most brokerage houses like ICICI Direct, Kotak Securities, and Motilal Oswal have bullish ratings on top banks.
They expect 10–15% upside in BFSI stocks over the next 6–12 months.
Morgan Stanley and Goldman Sachs are overweight on India’s banking sector in their Asia portfolio.
✍️ Final Thoughts
The Banking and Financial sector in India is booming for all the right reasons:
Strong economy
Clean books
Digital transformation
Massive credit demand
If you’re a trader — this sector offers great volatility and opportunity.
If you’re a long-term investor — this is where India’s structural growth is most visible.
Midcaps & Smallcaps Giving Multi-Bagger Moves🔍 What’s Going On in the Market?
If you’ve been watching the Indian stock market lately, you’ve probably noticed a massive rally in midcap and smallcap stocks. Stocks that were quietly trading in the background are now suddenly up 50%, 100%, or even 200% within months. Investors who took early positions in these counters are sitting on multi-bagger returns — and everyone wants a piece of the action.
You may have heard of recent examples like:
Suzlon Energy – up over 200% in a year
JTL Infra – up 5x in 2 years
Taneja Aerospace, Tata Tele, Lloyds Metals, Zen Tech, and others doubling in months
So, what’s behind this mega rally?
Should you join now or stay cautious?
Let’s break it all down — without jargon, just real talk.
💼 First, What Are Midcaps and Smallcaps?
These terms refer to the market capitalization (total value of a company’s shares).
Category Market Cap (Approx) Example Stocks
Large Cap ₹50,000 Cr+ Reliance, HDFC Bank, Infosys
Mid Cap ₹10,000 Cr to ₹50,000 Cr Cummins India, PI Industries
Small Cap Below ₹10,000 Cr Suzlon, JTL Infra, RCF
📌 Multi-bagger = A stock that gives 2x, 5x, or 10x returns on your investment
🔥 Why Are Midcaps & Smallcaps Flying in 2025?
Let’s look at the real reasons behind this boom.
1. Strong Economic Growth
India is projected to grow over 7%+ GDP in FY26, highest among large economies.
Sectors like defence, infra, power, and manufacturing are booming — and many mid/smallcap companies are direct beneficiaries.
2. Government Push for Capex & Manufacturing
Schemes like PLI (Production Linked Incentive), ‘Make in India’, and massive infrastructure spending have boosted earnings for niche companies.
Railways, roads, power, and defence see record budget allocations.
3. Retail Participation at All-Time High
More retail investors are trading and investing via Zerodha, Groww, Upstox, etc.
They’re moving beyond large caps and discovering low-priced high-potential stocks.
4. FIIs & DIIs Entering Midcaps Again
Big institutions avoided smallcaps for years due to volatility.
Now, even they are entering quality midcaps, fueling fresh momentum.
5. Technical Breakouts & Volume Surge
Chart patterns (like cup & handle, breakouts) are visible on hundreds of smallcap charts.
Delivery volumes (not just intraday) are rising — a bullish sign.
📈 Real Examples: 2023–2025 Multi-Bagger Stories
🌀 Suzlon Energy
Old wind energy player that was almost bankrupt.
Made a comeback with debt restructuring + clean energy narrative.
Went from ₹5 to ₹40+ in 2 years = 700%+ returns
🛠️ JTL Infra
Steel tube manufacturer for infra and construction.
Strong earnings, high promoter holding, and exports rising.
Stock gave 5x return from 2022 to 2025.
💣 Taneja Aerospace
In the aerospace + defence theme, a lesser-known player.
Low float, strong niche, government defence deals.
Stock moved from ₹90 to ₹500+ in less than 18 months.
These are just a few names. There are dozens of smallcap stocks giving 50–200% returns within 6–12 months.
🧠 The Psychology Behind the Rally
Retail Investors: "Small stocks are cheaper, I can buy 1000 shares instead of 5 of Reliance!"
Traders: "Breakouts with volume? Let’s ride it!"
Institutions: "Let’s grab quality midcaps before they become large caps."
This creates a self-fulfilling cycle:
Rising prices → More buzz → More buyers → Higher prices
🧭 But Is It Safe to Enter Now?
This is where you need clarity and discipline. Not all smallcap stocks are worth buying. Some are quality businesses growing fast. Others are just hype, junk, or operator-driven.
Here’s how to approach the current market:
✅ Smart Strategy to Ride the Rally
1. Focus on Fundamentals First
Ask:
Is the company profitable?
Is debt under control?
Are revenues & profits growing YoY?
Is promoter holding strong?
If yes, it's worth tracking.
2. Use Technical Confirmation
Look for:
Breakouts with volume
Sustained uptrends
Support-retest-bounce zones
Avoid chasing gaps blindly!
3. Track Themes That Are in Focus
Current hot mid/smallcap themes in 2025:
Theme Stock Examples
Defence Zen Tech, BEL, Taneja
Railway Infra RVNL, IRFC, Titagarh
Green Energy Suzlon, IREDA, KPI Green
Capital Goods JTL Infra, KEI, KEC
Fertilizers/Chem RCF, NFL, Deepak Nitrite
These themes are backed by government policy + earnings visibility.
4. Avoid Pump & Dump
Stay away from low-volume, “Telegram tip” kind of stocks.
Check if delivery % is high — if not, it’s probably a trap.
💡 Quick Checklist Before Buying a Smallcap
Question Good Sign?
Promoter Holding > 50%? ✅ Yes
Debt-to-Equity < 1? ✅ Yes
Consistent Profit Growth? ✅ Yes
Trading Above 200 EMA? ✅ Yes
Mentioned in Annual Budget/Sector News? ✅ Yes
If 4–5 of these match, it’s worth researching deeper.
🧾 What to Avoid
Stocks with huge moves but no earnings to justify it
“Operator stocks” — low float, sudden spikes, suspicious circuits
Tips from WhatsApp/Telegram without any proof
Stocks hitting back-to-back upper circuits without volume
These often crash when the tide turns.
🛡️ Risk Management Matters More Than Ever
Midcaps and smallcaps are high-return, high-risk areas.
You must:
Never put more than 10–20% of your portfolio in smallcaps
Use a stop-loss for every trade
Book partial profits on every 20–30% move
Don’t marry any stock — even the good ones fall eventually
📊 Long-Term vs. Short-Term Approach
If You’re a Long-Term Investor:
Stick to quality smallcaps with strong business models.
SIP method works well during volatile phases.
Great time to build wealth if you stay patient.
If You’re a Swing Trader:
Use technical setups: cup & handle, breakouts, flag patterns.
Trade 2–4 week timeframes.
Use position sizing — don’t go all in on one stock.
🔮 Outlook for 2025–26
With elections approaching and strong GDP, midcaps/smallcaps may continue to lead.
But correction or volatility is expected — markets don’t rise in a straight line.
Use dips to add, avoid panic exits.
✍️ Final Words
The midcap and smallcap rally in 2025 is not just a bubble — it’s being driven by real growth, real earnings, and massive retail interest. However, not every rising stock is worth chasing. Be selective, research-driven, and disciplined.
“Everyone wants multi-baggers. But only the patient and the smart ones actually catch them.