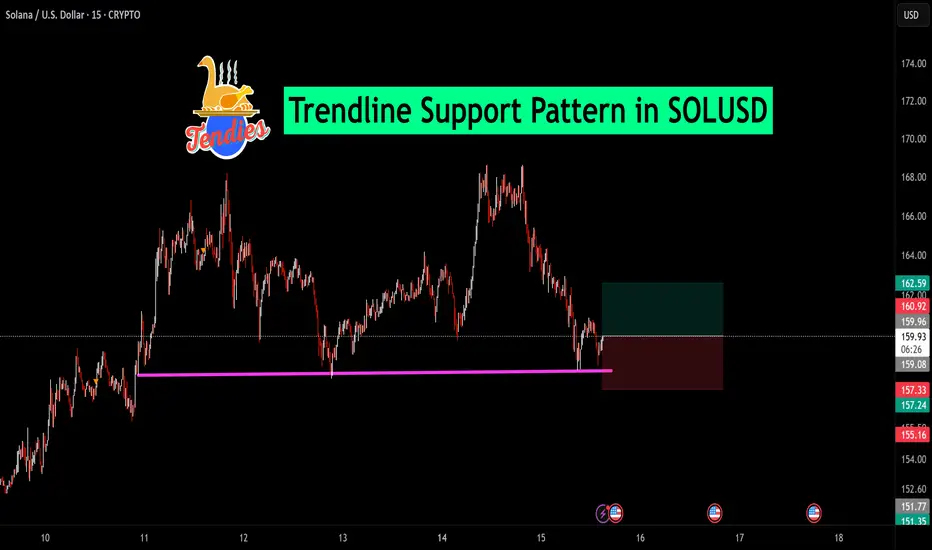
Trendline Support Pattern in SOLUSDSolana (SOLUSD) is currently holding a critical horizontal trendline support near the $157.20–$157.30 zone. Price has tested this level multiple times, confirming strong buyer interest around this area.
📈 Long Trade Setup:
Entry: Around $159.88
Stop Loss: Below $157.24
Target Zone: $162.59 and a
Key stats
About Solana
Solana is a blockchain fairly new to the crypto game, but that's not to say it's not a serious player. Attempting to rival smart-contract titan Ethereum for the NFT and web3 crown, Solana has a strong focus on scalability through its hybrid proof-of-history/proof-of-stake consensus that aims to accommodate a flourishing dApp ecosystem. Its native token SOL has enjoyed the successes of Solana-based NFTs and dApps, but since its inception has also felt the strain of the network’s tendency to experience outages. Although that hasn't stopped it from reaching the top 15 coins by market cap.
Related coins
Solana (SOLUSD) - 15min Chart Update🔄 Price Action: Solana is currently retesting the support zone around the $157 level, which has held firm multiple times as shown by the repeated bounces (highlighted by arrows).
📊 Trade Setup:
Support Level: $157
Entry Zone: Near support after confirmation
Target Zone: $158.69 – $159.08
Stop L
SOLUSD Trade Setup | 15-Min ChartSolana is currently respecting a strong intraday support zone (marked in pink), with multiple rejections seen at that level. After a sharp pullback, price has shown signs of base formation.
📌 Trade Idea:
Entered long position at support with a tight stop-loss just below the recent wick.
🎯 Target: 1
SOLUSD Fake Breakout & Reversal Setup | 15-Min ChartAfter a fake breakdown below the recent support, Solana (SOLUSD) is showing signs of reclaiming strength. Price has retested the $149.97 level, which acted as a key zone of liquidity, before resuming its upward march.
This move suggests that the earlier dip was a liquidity hunt, shaking out weak ha
Solana Long-Term Cup & Handle | +300% Potential🔍 #OnRadar | #Crypto
#SOLUSD (#Solana)
Solana Long-Term Cup & Handle | +300% Potential
CMP: $174
Support Zone: $123.00 – $100.00
Pattern Invalidation Level: $95 (MCB - Monthly Closing Basis)
📊 Technical Overview:
Solana (SOLUSD) is showing signs of a long-term Cup & Handle pat
SOLUSD Short Setup – 15 Min Chart AnalysisSolana recently made a strong upward move but faced rejection near the $175 zone. After forming a lower high and breaking structure, it has entered a corrective phase.
Currently, a potential short opportunity is shaping up as the price retests the previous support-turned-resistance near $171.20. Th
SOLUSD Trade Idea – Resistance Breakout Expected Solana (SOLUSD) is currently testing a key horizontal resistance zone around 163.2, marked by multiple rejections in the past. After consolidating beneath this level, the price has managed to reclaim the resistance zone, and now it appears to be retesting it as fresh support.
🔍 Technical Analysis H
Bearish Outlook on SOLUSD – Breakdown Below Key SupportSolana (SOLUSD) is showing a clear bearish structure on the 15-minute chart. The price has decisively broken below a crucial horizontal support zone near $149.50, which previously acted as a strong demand area.
This breakdown is accompanied by consistent lower highs and lower lows, confirming beari
Bearish View on SOLUSDSolana (SOLUSD) is showing signs of weakness after testing a strong resistance zone near $148.50–$149.00, where it previously faced selling pressure. The current 15-minute chart displays a sharp rejection from this resistance, followed by a bearish candle near the breakout level. This could indicate
Solana (SOLUSD) Update – 15M ChartPrice has perfectly retested the breakout zone near $131.80 (blue support level), showing a strong bounce from the previous resistance-turned-support. This retest confirms structure, and we may now expect a bullish continuation towards the $137.50–138.00 zone.
📌 Support Level: $131.80
🎯 Target: $13
See all ideas
Summarizing what the indicators are suggesting.
Oscillators
Neutral
SellBuy
Strong sellStrong buy
Strong sellSellNeutralBuyStrong buy
Oscillators
Neutral
SellBuy
Strong sellStrong buy
Strong sellSellNeutralBuyStrong buy
Summary
Neutral
SellBuy
Strong sellStrong buy
Strong sellSellNeutralBuyStrong buy
Summary
Neutral
SellBuy
Strong sellStrong buy
Strong sellSellNeutralBuyStrong buy
Summary
Neutral
SellBuy
Strong sellStrong buy
Strong sellSellNeutralBuyStrong buy
Moving Averages
Neutral
SellBuy
Strong sellStrong buy
Strong sellSellNeutralBuyStrong buy
Moving Averages
Neutral
SellBuy
Strong sellStrong buy
Strong sellSellNeutralBuyStrong buy
Displays a symbol's price movements over previous years to identify recurring trends.
Curated watchlists where SOLUSD is featured.

Gen 3 crypto: A new day dawns…
25 No. of Symbols

Smart contracts: Make the smart decision
36 No. of Symbols

Staking Coins: Pick up a stake
18 No. of Symbols

Top altcoins: Choose your alternatives carefully
28 No. of Symbols

Up-and-coming crypto: New kids on the block
30 No. of Symbols
See all sparks
Frequently Asked Questions
The current price of Solana (SOL) is 181.84 USD — it has risen 1.31% in the past 24 hours. Try placing this info into the context by checking out what coins are also gaining and losing at the moment and seeing SOL price chart.
The current market capitalization of Solana (SOL) is 97.79 B USD. To see this number in a context check out our list of crypto coins ranked by their market caps or see crypto market cap charts.
Solana (SOL) trading volume in 24 hours is 9.04 B USD. See how often other coins are traded in this list.
Solana price has risen by 8.45% over the last week, its month performance shows a 20.74% increase, and as for the last year, Solana has increased by 16.86%. See more dynamics on SOL price chart.
Keep track of coins' changes with our Crypto Coins Heatmap.
Solana (SOL) reached its highest price on Jan 19, 2025 — it amounted to 295.11 USD. Find more insights on the SOL price chart.
See the list of crypto gainers and choose what best fits your strategy.
Solana (SOL) reached the lowest price of 0.21 USD on Apr 10, 2020. View more Solana dynamics on the price chart.
See the list of crypto losers to find unexpected opportunities.
The current circulating supply of Solana (SOL) is 605.46 M USD. To get a wider picture you can check out our list of coins with the highest circulating supply, as well as the ones with the lowest number of tokens in circulation.
The safest choice when buying SOL is to go to a well-known crypto exchange. Some of the popular names are Binance, Coinbase, Kraken. But you'll have to find a reliable broker and create an account first. You can trade SOL right from TradingView charts — just choose a broker and connect to your account.
Crypto markets are famous for their volatility, so one should study all the available stats before adding crypto assets to their portfolio. Very often it's technical analysis that comes in handy. We prepared technical ratings for Solana (SOL): today its technical analysis shows the strong buy signal, and according to the 1 week rating SOL shows the strong buy signal. And you'd better dig deeper and study 1 month rating too — it's buy. Find inspiration in Solana trading ideas and keep track of what's moving crypto markets with our crypto news feed.
Solana (SOL) is just as reliable as any other crypto asset — this corner of the world market is highly volatile. Today, for instance, Solana is estimated as 5.30% volatile. The only thing it means is that you must prepare and examine all available information before making a decision. And if you're not sure about Solana, you can find more inspiration in our curated watchlists.
You can discuss Solana (SOL) with other users in our public chats, Minds or in the comments to Ideas.