EMA Pullback Entry – The Cleanest Setup for Trend Followers!Hello Traders!
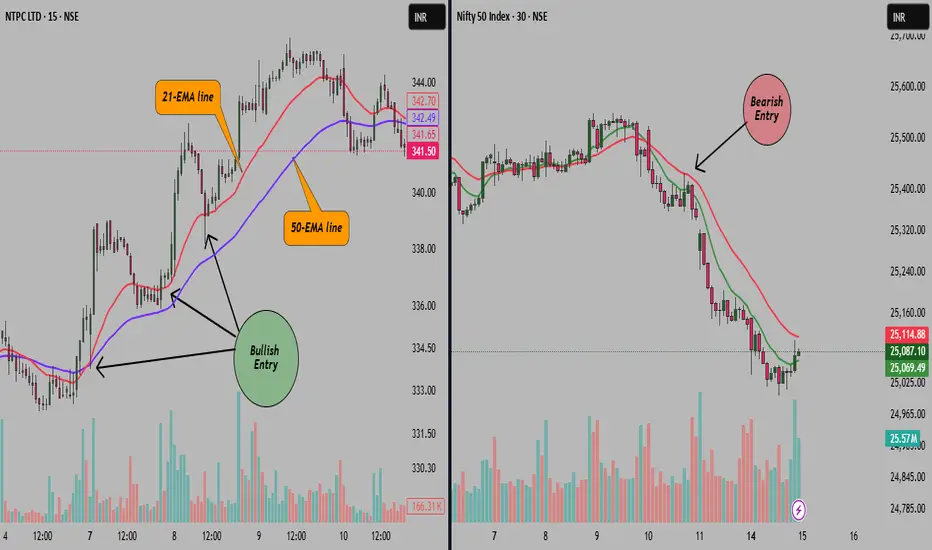
In today’s post, let’s explore one of the most reliable and beginner-friendly setups — the EMA Pullback Entry . If you’re a trend follower looking for clear, rule-based entries , this strategy will become a go-to in your toolkit. It helps you avoid chasing breakouts and instead ri
About Nifty 50 Index
NIFTY 50 is the main index for the National Stock Exchange of India (NSE). It tracks the performance of the top 50 stocks by market capitalization from 13 sectors of the Indian economy. With such a relatively small number of companies within the index it still represents over 60% of the free float market capitalization of the stocks listed on NSE, and serves as a benchmark for fund portfolios and index funds. The list of the NIFTY 50 Index constituents is rescheduled every 6 month.
Related indices
July is Historically a Bullish Month for NiftySaid earlier that NSE:NIFTY could pull back till 25000 and then bounce. And that's exactly what happened.
The quarterly rotation in the market seems to have completed. And today, supply started getting absorbed.
I’ve already mentioned before — July has historically been a positive month for the
NIFTY Analysis – 16july 2025 ,morning update at 9 amBase Reference: 1-Hour chart
Close: Just below 38.2% false level
Interpretation:
Market weak close ke sath open ho sakta hai.
38.2% false level ke niche close hone ka matlab — downtrend continue ho sakta hai unless recovery hoti hai.
📊 Expected Price Behavior (As per Analysis)
Scenario Level(
Diogonal formation in nifyIt seems gradually diogonal foemarion is taking place in nifty.
it is expected to bounce from the lower trend line .
Another move expected for completion of 5 th wave
then we can get some correction.
After that correction over all trend remains bullish for the
rest of the year.
If this post helps
Can NIFTY pull off a V shape recovery? - Possible DirectionNifty was bouncing off from the rising trendline.. but was it enough to make a V shape recovery?
The impulse 25540 needs a follow through..
And also, it has broken the channel on the downside and extended deep, that's a typical nature of 3rd wave.
Hence, considering this fall as 12345 to complete
NIFTY AT CRUCIAL LEVELSNifty witnessed the worst fall in past 2 months, thanks to the IT and AUTO sector. There were major reasons fundamentally like rupee falling , Tariffs on canada, weak start to earnings month and FII's selling .
However technically nifty gave a breakout on 25 june from the 25199 level and post 3 wee
Nifty ready to Bounce As mentioned in Friday’s commentary — a gap-down was expected in NSE:NIFTY , and that’s exactly what we saw.
I highlighted that the gap-down could happen below 25285 — and the market opened at 25255.
A bounce was expected near 25333 — and the bounce actually came, up to 25322.
It was clearly sta
Option Trading Part-1 What Is Institutional Option Trading?
Institutional Option Trading involves using derivatives (Options) for:
Hedging big equity portfolios
Speculating on volatility or price movement
Arbitrage opportunities
🔹 Key Techniques:
Volatility Arbitrage
Delta-Neutral Hedging
Covered Calls
Protective
Nifty July Iron Condor Strategy – Premiums are Still Attractive!Hello Traders!
After a strong April, May and June where all three our option writing strategies gave full profits, we are back again with the July edition. Market is respecting the range beautifully, and we are again going with a non-directional Iron Condor setup.
Let’s walk through the logic and
See all ideas
Summarizing what the indicators are suggesting.
Oscillators
Neutral
SellBuy
Strong sellStrong buy
Strong sellSellNeutralBuyStrong buy
Oscillators
Neutral
SellBuy
Strong sellStrong buy
Strong sellSellNeutralBuyStrong buy
Summary
Neutral
SellBuy
Strong sellStrong buy
Strong sellSellNeutralBuyStrong buy
Summary
Neutral
SellBuy
Strong sellStrong buy
Strong sellSellNeutralBuyStrong buy
Summary
Neutral
SellBuy
Strong sellStrong buy
Strong sellSellNeutralBuyStrong buy
Moving Averages
Neutral
SellBuy
Strong sellStrong buy
Strong sellSellNeutralBuyStrong buy
Moving Averages
Neutral
SellBuy
Strong sellStrong buy
Strong sellSellNeutralBuyStrong buy
Displays a symbol's price movements over previous years to identify recurring trends.
Frequently Asked Questions
The current value of Nifty 50 Index is 24,966.55 INR — it has fallen by −0.60% in the past 24 hours. Track the index more closely on the Nifty 50 Index chart.
Nifty 50 Index reached its highest quote on Sep 27, 2024 — 26,277.35 INR. See more data on the Nifty 50 Index chart.
The lowest ever quote of Nifty 50 Index is 279.00 INR. It was reached on Jul 3, 1990. See more data on the Nifty 50 Index chart.
Nifty 50 Index value has decreased by −1.17% in the past week, since last month it has shown a 0.69% increase, and over the year it's increased by 1.72%. Keep track of all changes on the Nifty 50 Index chart.
The top companies of Nifty 50 Index are NSE:RELIANCE, NSE:HDFCBANK, and NSE:TCS — they can boast market cap of 234.03 B INR, 178.17 B INR, and 136.13 B INR accordingly.
The highest-priced instruments on Nifty 50 Index are NSE:ULTRACEMCO, NSE:MARUTI, and NSE:BAJAJ_AUTO — they'll cost you 12,495.00 INR, 12,476.00 INR, and 8,330.00 INR accordingly.
The champion of Nifty 50 Index is NSE:BHARTIARTL — it's gained 32.91% over the year.
The weakest component of Nifty 50 Index is NSE:INDUSINDBK — it's lost −40.13% over the year.
Nifty 50 Index is just a number that lets you track performance of the instruments comprising the index, so you can't invest in it directly. But you can buy Nifty 50 Index futures or funds or invest in its components.
The Nifty 50 Index is comprised of 50 instruments including NSE:RELIANCE, NSE:HDFCBANK, NSE:TCS and others. See the full list of Nifty 50 Index components to find more opportunities.