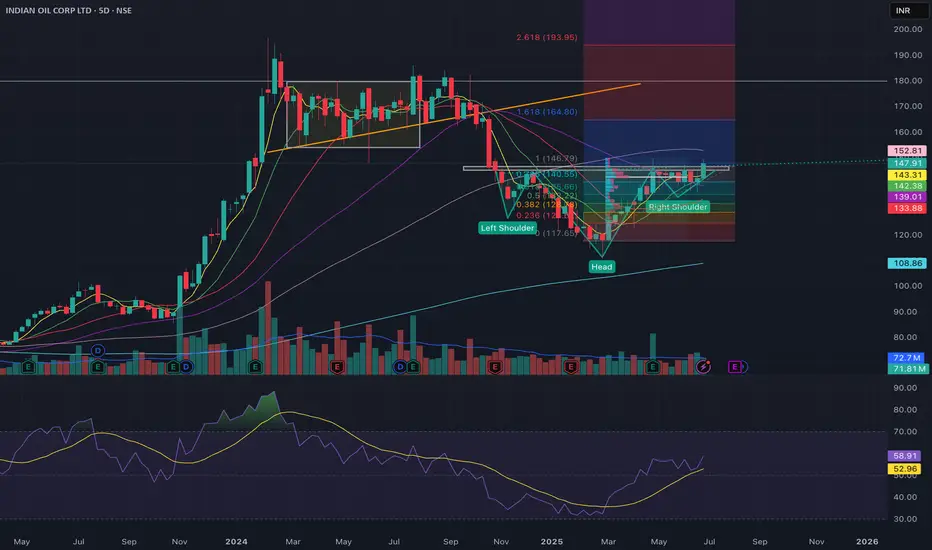
IOC - Breakout Candidate? Jump now or wait it out?
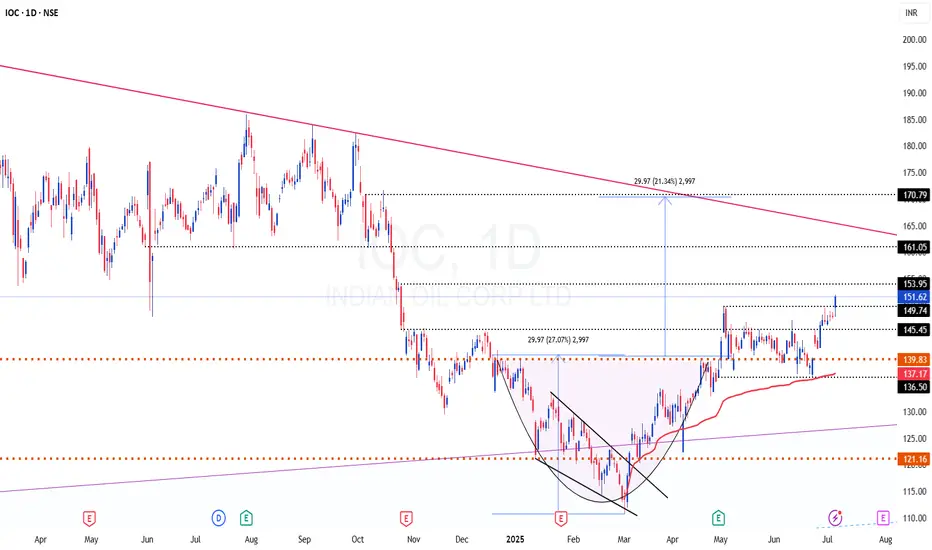
Levels are marked for easy/better understanding.
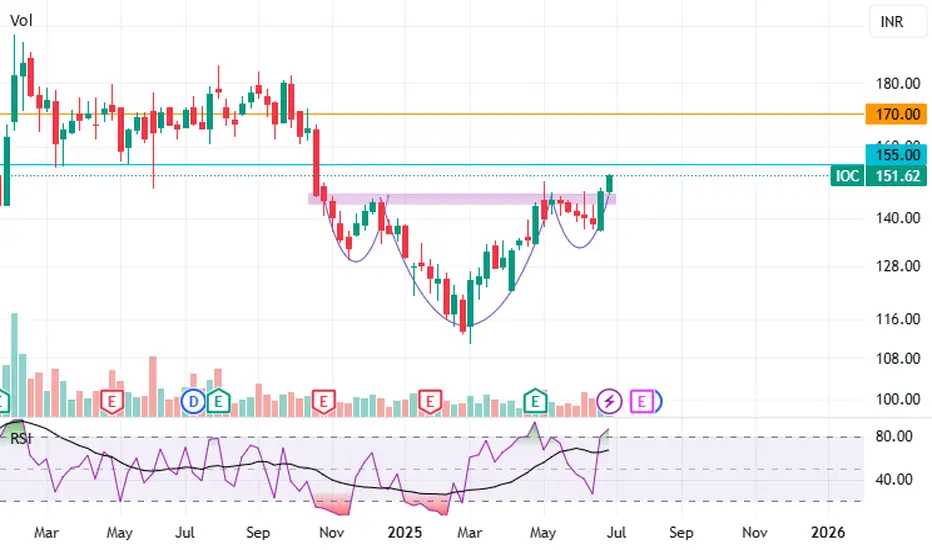
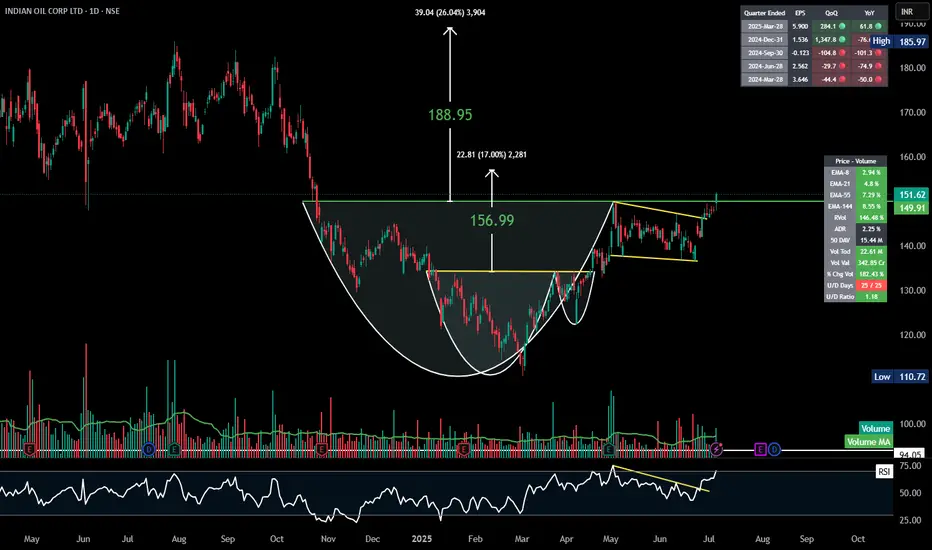
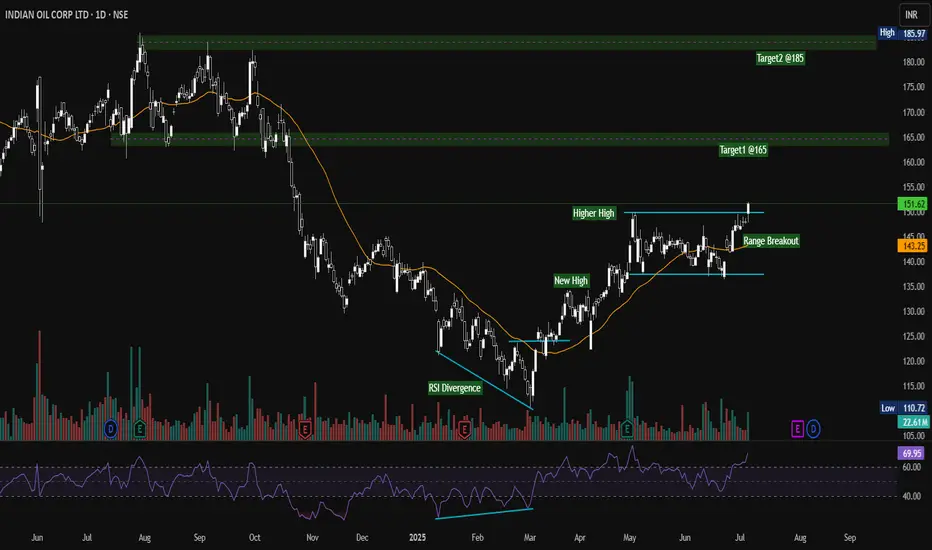
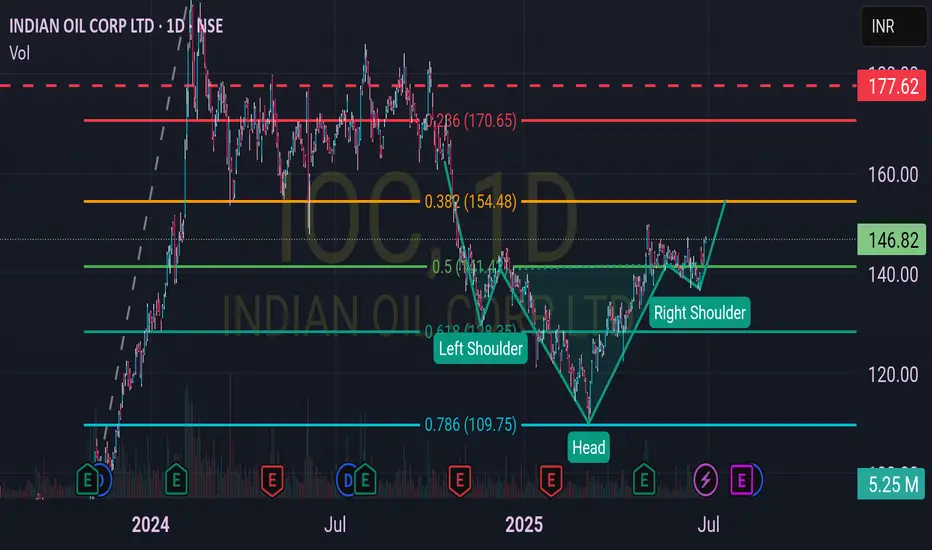
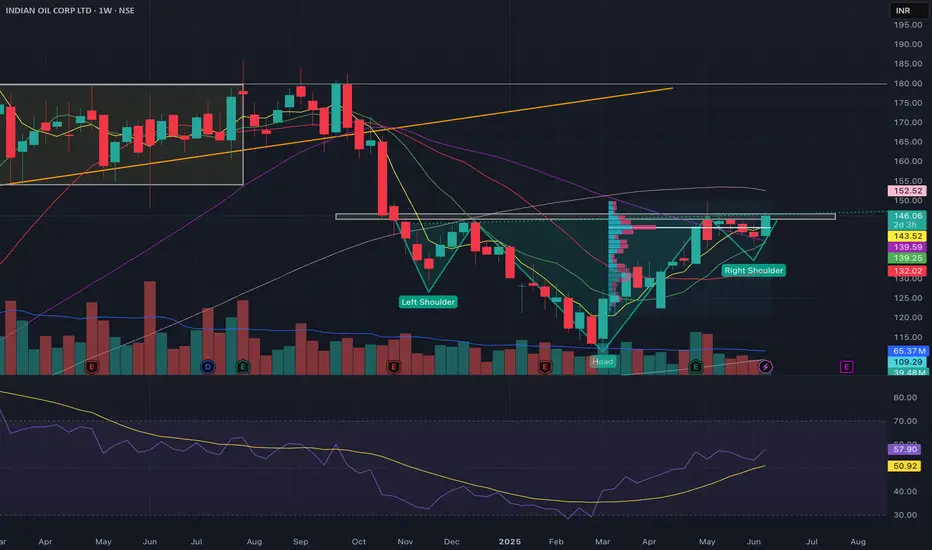
The chart looks like a clean breakout
But the following aspects makes me feel that it could give one DIP before resuming higher.
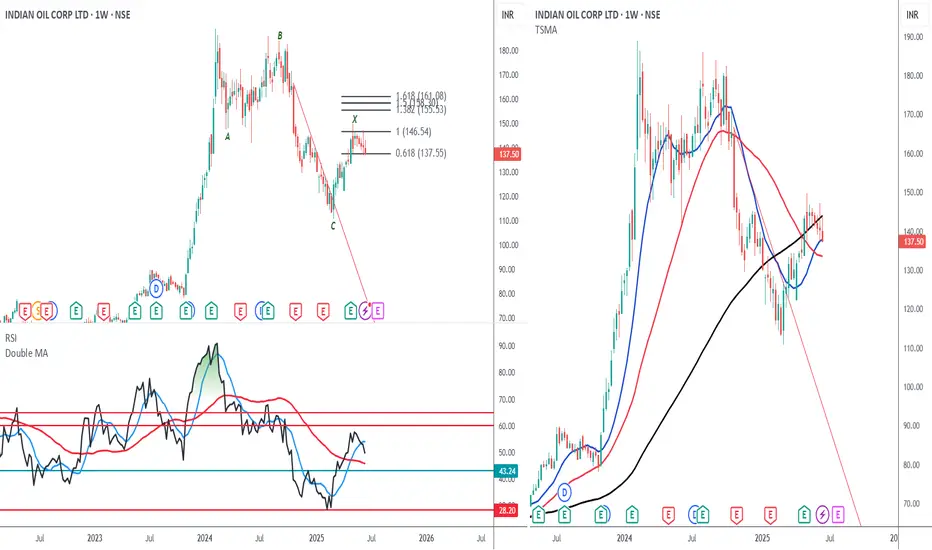
RSI looks stretched and trading in overbought territory on hourly and 4 hour TF
Weekly SuperTrend is at 152 levels
Next report date
—
Report period
—
EPS estimate
—
Revenue estimate
—
9.88 INR
135.98 B INR
7.58 T INR
3.77 B
About INDIAN OIL CORP LTD
Sector
Industry
Website
Headquarters
New Delhi
Founded
1959
ISIN
INE242A01010
FIGI
BBG000C1K6Q9
Indian Oil Corp. Ltd. is a holding company, which engages in refining, pipeline transportation, and marketing of petroleum products. It also explores and produces crude oil and gas; and markets natural gas and petrochemicals. It operates through the following business segments: Petroleum Products, Petro-Chemicals, and Other Businesses. The Other Businesses segment covers the sale of gas, explosives, and cryogenics; wins mill and solar power generation; and oil and gas exploration activities. The company was founded on June 30, 1959 and is headquartered in New Delhi, India.
Related stocks
Indian Oil Corporation Limited (IOC)Indian Oil Corporation Limited (IOC), is India’s largest government-owned oil and gas company, operating under the Ministry of Petroleum and Natural Gas.
IOC continued to fall from October last year to March,2025.
And for within 2 months 50% return (145 level), it was this is amazing performance.
IOC Range Breakout Confirmed | Bullish Momentum Building Toward NSE:IOC – Strong Bullish Setup with Range Breakout | Targets: ₹165 & ₹185
Indian Oil Corp Ltd (IOC) has shown a decisive breakout from a prolonged consolidation range, signaling strong bullish momentum. Price has crossed the resistance zone around ₹150–₹151 with significant volume, confirming the b
IOC - Fascinated by the Fibonacci!
Unveil the mesmerizing journey of Indian Oil Corp Ltd (IOC) on this captivating chart!
Behold the Fibonacci levels, meticulously drawn two months ago, revealing a fascinating truth.
Witness the price action align flawlessly with these golden ratios, a trader's dream come true.
Marvel at the e
the correction has resumedIOC CMP 137.42
Elliott- The rally is a zig zag and is over. Since it is corrective we call it X. Now a new set of A, B , C correction will happen from here.
Fibs- the rally cannot go past 50% is weakness.
RSI - the oscillation within the bear zone is telling that the trend is still down.
MA- n
See all ideas
Summarizing what the indicators are suggesting.
Neutral
SellBuy
Strong sellStrong buy
Strong sellSellNeutralBuyStrong buy
Neutral
SellBuy
Strong sellStrong buy
Strong sellSellNeutralBuyStrong buy
Neutral
SellBuy
Strong sellStrong buy
Strong sellSellNeutralBuyStrong buy
An aggregate view of professional's ratings.
Neutral
SellBuy
Strong sellStrong buy
Strong sellSellNeutralBuyStrong buy
Neutral
SellBuy
Strong sellStrong buy
Strong sellSellNeutralBuyStrong buy
Neutral
SellBuy
Strong sellStrong buy
Strong sellSellNeutralBuyStrong buy
Displays a symbol's price movements over previous years to identify recurring trends.
725IOCL30
IOCL-7.25%-6-1-30-PVTYield to maturity
6.90%
Maturity date
Jan 6, 2030
741IOCL29
IOCL-7.41%-22-10-29-PVTYield to maturity
—
Maturity date
Oct 22, 2029
736IOCL29
IOCL-7.36%-16-7-29-PVTYield to maturity
—
Maturity date
Jul 16, 2029
779IOCL32
IOCL-7.79%-12-4-32-PVTYield to maturity
—
Maturity date
Apr 12, 2032
714IOCL27
IOCL-6-9-27-PVTYield to maturity
—
Maturity date
Sep 6, 2027
550IOCL25
IOCL-5.50%-20-10-25-PVTYield to maturity
—
Maturity date
Oct 20, 2025
614IOCL27
IOCL-6.14%-18-2-27-PVTYield to maturity
—
Maturity date
Feb 18, 2027
744IOCL27
IOCL-7.44%-25-11-27-PVTYield to maturity
—
Maturity date
Nov 25, 2027
IOCL9525
IOCL-08-08-25-CPYield to maturity
—
Maturity date
Aug 8, 2025
560IOCL26
IOCL-5.60%-23-1-26-PVTYield to maturity
—
Maturity date
Jan 23, 2026
See all IOC bonds
Curated watchlists where IOC is featured.

Downstream oil: Petroleum through the pipes
39 No. of Symbols
See all sparks
Frequently Asked Questions
The current price of IOC is 150.06 INR — it has decreased by −0.60% in the past 24 hours. Watch INDIAN OIL CORP LTD stock price performance more closely on the chart.
Depending on the exchange, the stock ticker may vary. For instance, on NSE exchange INDIAN OIL CORP LTD stocks are traded under the ticker IOC.
IOC stock has fallen by −3.19% compared to the previous week, the month change is a 6.41% rise, over the last year INDIAN OIL CORP LTD has showed a −11.73% decrease.
We've gathered analysts' opinions on INDIAN OIL CORP LTD future price: according to them, IOC price has a max estimate of 214.00 INR and a min estimate of 85.00 INR. Watch IOC chart and read a more detailed INDIAN OIL CORP LTD stock forecast: see what analysts think of INDIAN OIL CORP LTD and suggest that you do with its stocks.
IOC stock is 2.03% volatile and has beta coefficient of 1.21. Track INDIAN OIL CORP LTD stock price on the chart and check out the list of the most volatile stocks — is INDIAN OIL CORP LTD there?
Today INDIAN OIL CORP LTD has the market capitalization of 2.13 T, it has increased by 0.20% over the last week.
Yes, you can track INDIAN OIL CORP LTD financials in yearly and quarterly reports right on TradingView.
INDIAN OIL CORP LTD is going to release the next earnings report on Jul 31, 2025. Keep track of upcoming events with our Earnings Calendar.
IOC earnings for the last quarter are 5.90 INR per share, whereas the estimation was 0.49 INR resulting in a 1.11 K% surprise. The estimated earnings for the next quarter are 5.41 INR per share. See more details about INDIAN OIL CORP LTD earnings.
INDIAN OIL CORP LTD revenue for the last quarter amounts to 2.23 T INR, despite the estimated figure of 1.95 T INR. In the next quarter, revenue is expected to reach 1.82 T INR.
IOC net income for the last quarter is 81.24 B INR, while the quarter before that showed 21.15 B INR of net income which accounts for 284.04% change. Track more INDIAN OIL CORP LTD financial stats to get the full picture.
Yes, IOC dividends are paid annually. The last dividend per share was 7.00 INR. As of today, Dividend Yield (TTM)% is 7.95%. Tracking INDIAN OIL CORP LTD dividends might help you take more informed decisions.
INDIAN OIL CORP LTD dividend yield was 2.35% in 2024, and payout ratio reached 30.40%. The year before the numbers were 7.15% and 39.60% correspondingly. See high-dividend stocks and find more opportunities for your portfolio.
EBITDA measures a company's operating performance, its growth signifies an improvement in the efficiency of a company. INDIAN OIL CORP LTD EBITDA is 362.09 B INR, and current EBITDA margin is 4.78%. See more stats in INDIAN OIL CORP LTD financial statements.
Like other stocks, IOC shares are traded on stock exchanges, e.g. Nasdaq, Nyse, Euronext, and the easiest way to buy them is through an online stock broker. To do this, you need to open an account and follow a broker's procedures, then start trading. You can trade INDIAN OIL CORP LTD stock right from TradingView charts — choose your broker and connect to your account.
Investing in stocks requires a comprehensive research: you should carefully study all the available data, e.g. company's financials, related news, and its technical analysis. So INDIAN OIL CORP LTD technincal analysis shows the buy rating today, and its 1 week rating is buy. Since market conditions are prone to changes, it's worth looking a bit further into the future — according to the 1 month rating INDIAN OIL CORP LTD stock shows the buy signal. See more of INDIAN OIL CORP LTD technicals for a more comprehensive analysis.
If you're still not sure, try looking for inspiration in our curated watchlists.