

AUDCAD BULLISH BIASClearly 15m shows good sign of strength with supporting ascending TL. We can look for long at the current price value.

 Long
Long Short
Short Long
Long Long
Long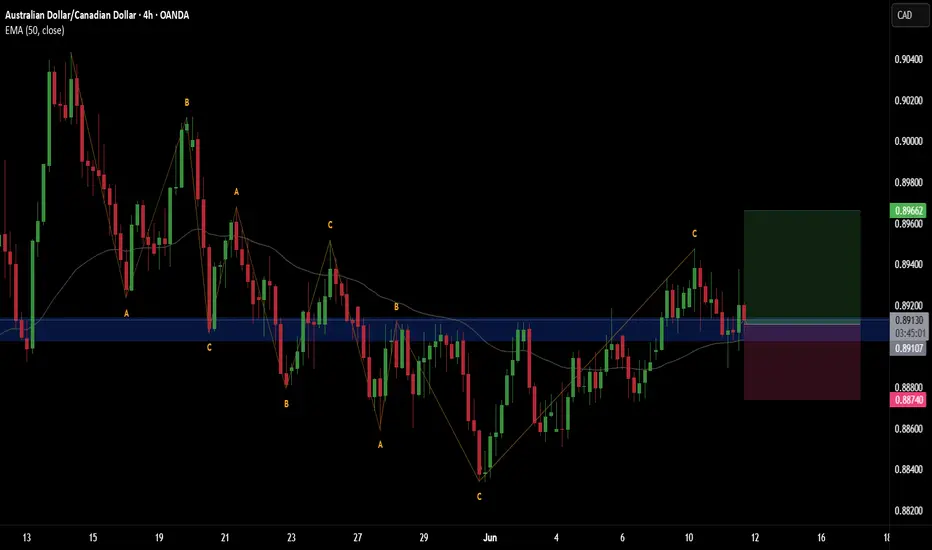 Short
Short Short
Short Long
Long Short
Short Long
Long Education
 Long
Long Long
Long Long
Long Short
Short Long
Long Long
Long Long
Long Long
Long Short
Short Short
Short Short
Short Long
Long Short
Short