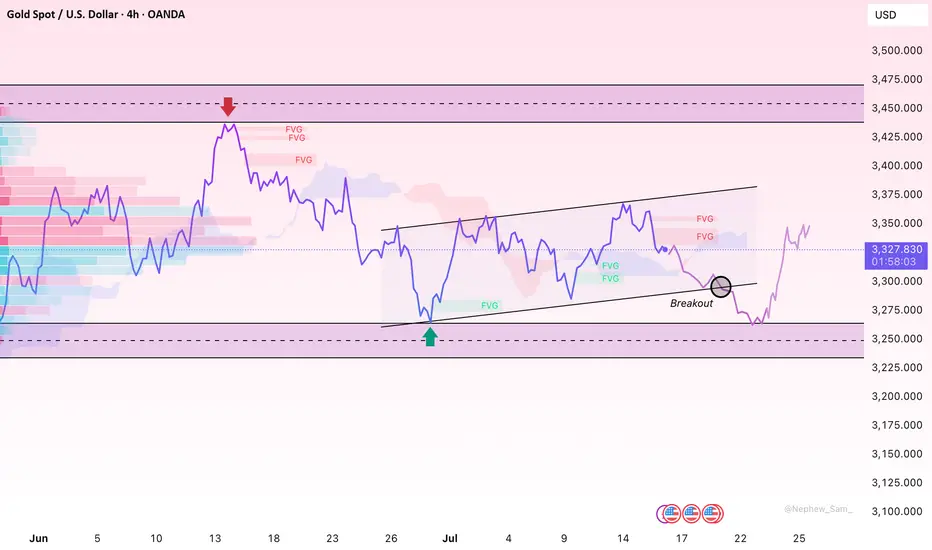
Gold Faces Resistance at Equilibrium Zone Gold is attempting a modest rebound after falling from its recent highs near the $3,360–$3,370 zone. However, the current structure shows that momentum is not strong enough to confirm a sustained uptrend. On the H1 chart, a series of Fair Value Gaps (FVGs) have formed on both sides, suggesting a renewed imbalance in liquidity.
Price is now approaching the red FVG zone near $3,345–$3,350 – a previously rejected area that may act as near-term resistance. If candles fail to close above this region with convincing volume, the risk of a downward reversal toward the green FVG zone around $3,320 remains significant.
Ichimoku also signals indecision: the Kumo cloud is flattening and thinning – a classic sign of trend uncertainty. Price is hovering near the lower boundary of the cloud, without a clean breakout, indicating the market is still in a consolidation phase.
A retest of the $3,350 FVG zone with a clear reversal candle (e.g., a bearish engulfing) could be the first sign that sellers are stepping back in.
Personally, I’ll be watching this zone closely and only act upon confirmed signals – avoiding FOMO trades in uncertain ranges. In a bearish scenario, targets include the $3,320 level and the untested liquidity zone near $3,300.
Just my chart-based opinion – not financial advice. Always validate your own strategy and manage risk responsibly.
Trading
Advance Option Trading✅ What is Advanced Options Trading?
At the advanced level, traders use option combinations, multi-leg strategies, and hedging techniques to:
Maximize profits
Minimize risks
Take advantage of market volatility and time decay (Theta)
You don’t just predict direction; you trade direction, volatility, and time decay together.
✅ Core Concepts in Advanced Options Trading
1. Greeks Mastery
Delta: Measures how much the option price moves with the underlying asset.
Gamma: Rate of change of Delta.
Theta: Time decay — how much the option loses value every day.
Vega: Sensitivity to volatility changes.
Rho: Impact of interest rate changes (used less by retail).
Understanding Greeks helps you manage profits and risks more precisely
3. Volatility Trading
Institutions trade implied volatility (IV), not just price direction. Advanced traders use tools like IV Rank and IV Percentile to:
Sell options when IV is high (premium rich)
Buy options when IV is low (cheap options)
4. Hedging Techniques
Use options to protect your portfolio from major losses.
Example: Holding stocks and buying Protective Puts to limit downside risk.
Example: Selling Covered Calls to generate monthly income on stock holdings.
✅ Benefits of Advanced Options Trading
💸 Profit in Any Market Condition (up, down, sideways)
⏳ Earn from Time Decay (Theta Decay)
🛡️ Control Risk with Defined Risk Strategies
🎯 Higher Probability of Consistent Returns
📉 Less Capital, More Leverage
✅ Who Should Learn Advanced Option Trading?
✅ Traders with basic options knowledge
✅ Investors wanting to hedge portfolios
✅ Intraday or positional traders
✅ Those seeking consistent monthly income
✅ Final Thoughts
Advanced Options Trading transforms you from a simple buyer/seller to a strategic trader who uses market forces smartly. You don’t chase trades — you set up calculated, high-probability positions and let the market work for you.
Radhika Jeweltech – Classic Contraction PatternTimeframe: Weekly
Structure Observed: Contraction Pattern between Trendlines
Volume: Significant recent uptick 📊
Key Zones:
🔴 Supply Zone above 123
🟢 Dynamic Support from ascending trendline
🟠 Active counter-trendline now breached
After months of lower highs and higher lows, the price has been squeezing into a classic contraction pattern between a descending orange trendline (acting as counter-trendline resistance) and a rising green trendline providing consistent support.
This week’s candle has decisively broken above the descending trendline on strong relative volume.
With the weekly close due tomorrow, all eyes remain on how the candle settles — will it sustain this breakout structurally or retreat below the trendline?
📌 Important Note: This is a technical observation — not a trade recommendation.
Geopolitical & US Macro WatchWhat Is Geopolitical & US Macro Watch?
This is a two-part term:
1. Geopolitical Watch
This refers to tracking and analyzing global political situations that can impact trade, oil, currency, defense, or investor confidence. Examples include:
Wars or conflicts (Ukraine-Russia, Israel-Gaza, China-Taiwan)
Global oil sanctions
Strategic alliances (e.g., BRICS+ expansion, NATO decisions)
Diplomatic tensions between countries
These events influence:
Crude oil prices
Foreign exchange rates
FII flows (Foreign Institutional Investment)
Global demand-supply outlooks
2. US Macro Watch
This focuses on tracking economic developments in the United States, the world's largest economy. Key areas to watch include:
Inflation reports (CPI, PCE)
US Federal Reserve interest rate decisions
Jobs data (non-farm payrolls, unemployment rate)
Retail sales, housing starts
US GDP growth
U.S. debt levels and political decisions on trade/tariffs
Because the US dollar is the world's reserve currency, and because Wall Street often sets the tone for global markets, these macro signals directly affect India’s equity market, bond yields, and rupee valuation.
🧠 Why Does This Matter to Indian Traders & Investors?
You may ask—“Why should I care about some news in the U.S. or Europe when I’m only buying shares of Indian companies?”
Here’s the reality:
Over 50% of the daily movement in Indian indices like Nifty and Sensex is now influenced by global cues.
Foreign investors (FIIs), who own a huge portion of Indian stocks, take buy/sell decisions based on global trends, not just local stories.
US interest rates affect where FIIs want to put their money—if US bonds are yielding more, they might pull out of India.
Crude oil, which India imports heavily, is priced globally—if a war breaks out, oil shoots up and hits inflation in India.
In short: What happens outside India often decides how India trades.
🔥 Major Geopolitical Risks in 2025
Let’s look at some real-world developments that have been shaking or supporting markets this year:
1. Russia-Ukraine Conflict (Still Ongoing)
Even in 2025, the war isn’t over.
It affects wheat prices, natural gas, and military spending globally.
India has been balancing ties with both Russia and the West, but disruptions affect commodity markets, logistics, and inflation.
2. Middle East Tensions (Gaza, Iran, Red Sea Attacks)
Ongoing conflicts have kept crude oil prices elevated.
Shipping through the Suez Canal and Red Sea has become riskier, increasing global logistics costs.
This directly affects India’s import bill, trade deficit, and rupee stability.
3. US–China Trade Friction
The US has imposed tech restrictions on China; China is retaliating.
If tensions escalate further, it will impact the global supply chain, especially for semiconductors, electronics, and electric vehicles.
Indian tech companies (like TCS, Wipro) may see ripple effects due to changes in global outsourcing dynamics.
4. Taiwan Risk
Any Chinese military action on Taiwan could be catastrophic for markets, especially in electronics and semiconductors.
Since semiconductors power everything from phones to EVs, even a threat here affects stocks globally.
📊 Key US Macro Trends Impacting Markets in 2025
1. US Inflation is Cooling, But Not Gone
After peaking in 2022, inflation has come down, but in 2025, it’s still sticky.
That means the Federal Reserve (US central bank) is not cutting rates as aggressively as markets hoped.
➡️ When the Fed keeps rates high:
US bond yields rise
FIIs pull money out of emerging markets like India
Nifty and Sensex feel the pressure
2. US Job Market Is Strong
A robust job market signals continued economic expansion, good for global demand.
This is why metals, IT, and manufacturing stocks in India rally when US jobs data is good.
3. The Fed’s Interest Rate Policy
The biggest global event each month is the Fed meeting.
If they cut rates, stocks rally globally.
If they pause or raise rates, money flows into safe assets like gold or the US dollar—hurting Indian equities.
Real-Time Example: July 2025
In July 2025, Indian markets have been:
Rallying due to strong US jobs data and earnings
Cautious due to potential Trump-era tariffs on countries buying Russian oil
Watching closely for US inflation print and Fed meeting signals
GIFT Nifty shows bullish strength in pre-market hours when the US ends green. But we’ve also seen sell-offs on days of oil spikes or war-related news.
🧭 How to Track These Developments (Even If You’re Busy)
Here’s a simple checklist for staying informed:
✅ Every Morning
Check GIFT Nifty
Read major global headlines (US data, oil prices, geopolitics)
Note the USDINR trend
Watch India VIX
✅ Every Week
Look at US job reports, inflation (CPI), and Fed speeches
Follow crude oil and gold charts
Track FII/DII activity
Keep an eye on shipping, metals, and defense-related stocks
✅ Final Thoughts
"Geopolitical & US Macro Watch" is not just a fancy term—it's a crucial lens for today’s markets. The biggest stock market moves often come not from company news but from macroeconomic surprises or global tensions.
In 2025, being globally aware gives you an edge:
You’ll avoid panic on news-driven crashes
You’ll better understand why your portfolio is up or down
You’ll identify trade setups ahead of others
👉 Think global, act local—that’s the new mantra for smart Indian investors.
If you want daily or weekly updates summarizing these events and their impact on Indian markets, let me know—I’ll be happy to prepare a custom watchlist or dashboard for you
Sensex – 1 Day Timeframe✅ Closing Summary:
Closing Price: ₹82,540.65
Change: −₹501.34 (−0.60%)
Opening Price: ₹83,081.80
Intraday High: ₹83,114.95
Intraday Low: ₹82,488.25
The Sensex fell over 500 points, reflecting broad-based selling across banking, IT, and financial services. The index struggled to hold gains and faced resistance at higher levels throughout the day.
🔍 Key Reasons for the Decline:
Weak Earnings from Financials:
Axis Bank and other financial stocks reported disappointing quarterly results.
As financial stocks hold significant weight in the Sensex, this created negative sentiment across the board.
IT and Tech Sector Pressure:
Global uncertainty, U.S. Fed rate concerns, and weak guidance from global tech firms contributed to a fall in Indian IT stocks like Infosys and TCS, dragging the index.
Foreign Institutional Investor (FII) Selling:
FIIs were net sellers in July, putting pressure on large-cap blue-chip stocks.
Persistent outflows created downward pressure on the index despite support from domestic institutional buyers.
Global Market Cues:
Mixed global signals, rising oil prices, and uncertain interest rate outlooks kept risk sentiment subdued.
Caution ahead of major global economic data further prevented buying enthusiasm.
📈 Technical Outlook (Short-Term):
Support Zone: ₹82,300 to ₹82,000
This is a key demand zone. A breakdown below could lead to further downside towards ₹81,500.
Resistance Zone: ₹83,150 to ₹83,500
Any bounce-back will face selling near this region unless backed by strong buying volume.
Indicators:
RSI: Dropped below 45, indicating weakening strength.
MACD: Shows a bearish crossover, confirming short-term negative momentum.
Volume: Heavier than average, signaling increased institutional activity on the sell side.
📆 Recent Trend Performance:
1-Day Return: −0.60%
1-Week Return: −0.45%
1-Month Return: +1.85%
6-Month Return: +12.3%
1-Year Return: +11.7%
The index remains strong over the long term, but the short-term chart reflects a corrective phase amid sectoral weakness.
🧠 What Traders & Investors Should Know:
Short-Term Traders: Monitor the 82,300 level for signs of bounce or breakdown. Potential intraday setups are forming, but caution is advised.
Swing Traders: Wait for a confirmation candle—like a bullish engulfing or hammer—near the support before entering long positions.
Long-Term Investors: This correction may offer a healthy buy-on-dip opportunity, particularly in stocks with strong fundamentals in auto, capital goods, and FMCG sectors.
💬 Conclusion:
The Sensex declined nearly 0.60% due to earnings pressure from major financials and global uncertainty impacting IT and large-cap stocks. While the market sentiment remains weak in the short term, the long-term uptrend is still intact. Key support around ₹82,300 will determine the near-term direction. If held, a rebound may follow next week, especially if major earnings turn out better than expected.
18/07 Gold Outlook – Final Friday Liquidity Moves Ahead!🟡 Gold Outlook – Final Friday Liquidity Moves Ahead!
Will Gold maintain its bullish pace or face weekend volatility? Stay ahead of the market!Why Gold is Moving – Key Macro Drivers
Gold bounced back sharply after a dip caused by stronger-than-expected US economic data. Here’s what Indian traders need to keep in mind:
📊 Rate cut hopes remain high as US core inflation remains sticky.
💣 Middle East tensions continue, with Israel launching more airstrikes on Syria.
🌐 Trade war risks increase as EU threatens $84B in tariffs on US goods.
🟡 Gold is acting as a safe haven in times of inflation concerns and global uncertainty.
👉 All of these factors support gold’s upside — especially heading into the weekend when low liquidity can cause price swings.
📉 Technical Picture – Zones in Play
Gold reversed from FLZ H2 (3310) — a key liquidity and demand zone. Sellers took profits, triggering a surge in buy volume. The price has since tested the OBS Sell Zone + Continuation Pattern (CP) around 334x with strong resistance.
Today, we expect price to revisit lower liquidity pools on the M30–H2 timeframe before the next breakout.
🧭 Key Levels for Friday – Watch Closely
✅ Buy Zone: 3318 – 3316
SL: 3312
TP Targets: 3322 – 3326 – 3330 – 3335 – 3340 – 3345 – 3350 – 3360
💼 Scalp Buy Zone: 3326 – 3324
SL: 3320
TP: 3330 – 3335 – 3340 – 3345 – 3350 – 3360
⚠️ Sell Zone: 3363 – 3365
SL: 3370
TP: 3360 – 3355 – 3350 – 3346 – 3342 – 3338 – 3335 – 3330
🔔 Important Notes for Indian Traders
Today is Friday, and even though there’s no major economic news, the risk of liquidity sweeps and volatility is high. Protect your capital with solid risk management and stick to your TP/SL strategy.
📌 Plan your entries from strong technical zones and don’t chase price — let the market come to you.
Everyone’s bullish now… but smart traders are waiting for this EEthereum just tapped a key resistance near $3,672 and is starting to show signs of cooling off.
A healthy retracement could bring ETH back to:
0.382 Fib – $2,970
0.5 Fib – $2,781
0.618 Fib – $2,605 (Strong demand zone)
IMO, we can expect ETH to revisit the $2,700–$3,000 zone before the next leg up.
This area will be the golden re-entry for long-term targets of $6,000–$8,000.
Stop-loss: Recent high and candle close above $3,675
Structure remains bullish:
✅ Previous dips into Fibs triggered strong buybacks
✅ Clean higher highs and higher lows
✅ Demand zone + retracement = opportunity
My View: Let price pull back. Then load up again. Bigger wave incoming.
DYOR | NFA
DOGE Long Swing Setup – Institutional Narrative Heating UpThe Dogecoin narrative is back in focus! Bit Origin ( NASDAQ:BTOG ) is raising $500M to build one of the world’s largest DOGE treasuries—becoming the first U.S.-listed company to treat CRYPTOCAP:DOGE as a core asset. With institutional interest rising, DOGE could see renewed momentum. Our last trade surged 50%—here’s the next entry:
📌 Trade Setup:
• Entry Zone: $0.20 – $0.21
• Take Profit Targets:
o 🥇 $0.23 – $0.24
o 🥈 $0.27 – $0.28
• Stop Loss: Daily close below $0.18
#crypto #DOGE #BTOG
Gold’s Next Move After False Headlines & Liquidity sweepXAUUSD 17/07 – MMF Insights: Gold’s Next Move After False Headlines & Liquidity Sweep
🧭 Market Sentiment: Macro Distractions Fuel Uncertainty
The gold market remains under pressure as conflicting geopolitical news and central bank rumors stir volatility. The week opened with rumors that Donald Trump might fire Fed Chair Jerome Powell, sending temporary fear across markets. While Trump later denied the claim, the damage was already done – sentiment remains fragile.
Other active drivers:
Israel’s airstrikes in Syria increase global tension.
EU proposes tariffs on US imports, adding trade friction.
BlackRock warns of delayed inflation pressure as tariffs begin impacting electronics & consumer goods.
💡 All these elements support gold’s potential role as a hedge, but technical signals suggest the market remains undecided.
🔍 MMF Technical Flow Outlook
According to MMF analysis, price structure is unfolding in line with expected liquidity sweeps and order block reactions:
Price rejected from key supply zones near 3,342 – 3,344 (OB + CP structure).
Current bounce around 3,330 – 3,320 signals possible accumulation.
If buyers hold above 3,310, we may see price test the upper OB/VPOC zones again.
Break below 3,310 opens the door toward the MMF liquidity trap zone at 3,296 – 3,294.
🎯 Trade Plan – Precision Entries
🟩 Buy Zone
Entry: 3,312 – 3,310
Stop Loss: 3,306
Take Profits:
→ 3,316 → 3,320 → 3,324 → 3,328 → 3,335 → 3,340 → 3,350
✅ This zone aligns with MMF liquidity retention and H1 continuation structure. Watch for bullish confirmation candles before entry.
🟥 Sell Zone
Entry: 3,362 – 3,364
Stop Loss: 3,368
Take Profits:
→ 3,358 → 3,354 → 3,350 → 3,345 → 3,340
⚠️ Ideal for short-term scalping or reversal confirmation setups. Rejection at VPOC or CP structure validates this zone.
⚠️ Key Notes for Indian Traders
Today’s sentiment is fragile and can shift fast with any unexpected statement from US Fed or geopolitical update.
Apply MMF structure in lower timeframes (M15/H1) for cleaner confirmation.
Avoid early entries. Wait for reaction signals near the marked zones.
💬 What Do You See Ahead?
Will MMF signals lead the market toward the deep FVG zone around 3,296?
Or are bulls getting ready to reclaim 3,360+ zones?
👇 Share your view and let’s trade smarter together with MMF precision.
Gold Surges After Softer PPI – Is a New Rally in the Making?Gold spiked sharply following a cooler-than-expected U.S. PPI for June, signaling easing inflationary pressures at the producer level. This immediately triggered a pullback in the dollar and yields, reigniting flows into precious metals.
On the H2 chart, gold rebounded strongly from the $3,325 support area, filling a Fair Value Gap and climbing past $3,340. Bullish momentum is building, as rising volume around $3,330 reflects growing demand.
Meanwhile, dovish signals from Europe have caused significant EUR volatility, indirectly weighing on the U.S. Dollar Index and reinforcing gold's upside bias. If gold holds above $3,325, a test of $3,360–$3,378 looks increasingly likely in the short term.
Gold is no longer just reacting to data—it’s getting ahead of expectations. Are you?
KOTAKBANK 1D TimeframeWhy KOTAKBANK?
Kotak Mahindra Bank is one of India’s most reputed private banks. It’s known for its conservative lending practices, healthy balance sheet, and strong retail plus corporate banking mix. Over the past few quarters, the bank has focused on digital transformation, stable asset quality, and maintaining margins despite rising interest rate pressures. Because of this, it’s always on the radar of long-term investors.
Now in 2025, with the financial sector showing resilience, KotakBank is gaining attention again—especially among those looking to buy on dips or add during consolidation phases.
✅ Current Price Range
As of mid-July 2025, KotakBank is trading near ₹2,185–₹2,190.
On the 1-day chart, it is showing signs of sideways consolidation with support at lower levels and limited upside pressure—this is perfect for long-term accumulation.
🔍 Key Investment Levels (Support & Resistance)
Let’s break it down into zones:
🟩 Support Zones (Ideal Buy Areas)
These are the levels where buyers often enter and prices tend to bounce back.
₹2,160 – ₹2,175
→ This is your first buy zone. It’s a cushion where the price may fall and stabilize before heading back up. Great for small quantity entry.
₹2,140 – ₹2,154
→ A stronger support zone. If the stock dips further, this is where serious long-term buyers often start accumulating. This level has held up multiple times in the past few months.
₹2,125 – ₹2,130
→ This is the last major support level on the daily timeframe. If the price falls below this zone, it might signal short-term weakness, and one should be cautious or wait for stability.
🟥 Resistance Zones (Profit Booking Areas)
These are levels where the stock might face selling pressure, especially short-term traders looking to book profits.
₹2,194 – ₹2,196
→ This is the first resistance area. If you’re already holding from lower levels, consider partial profit booking here.
₹2,209 – ₹2,228
→ A stronger resistance zone. This has acted as a ceiling for the stock recently. If KotakBank closes above this with strong volume, it may break out for fresh highs.
Above ₹2,228
→ If the stock closes above this level on the daily chart, it could start a new rally towards ₹2,260–₹2,300 zone. This level becomes a breakout confirmation point.
🧠 How to Use These Levels (Simple Plan)
🟢 If You’re a Long-Term Investor:
Start buying small quantities if KotakBank dips to ₹2,160–₹2,175.
Add more at ₹2,140–₹2,154 only if market sentiment remains stable.
Stop-loss: If price goes below ₹2,125 and stays there, pause further buying. It may need time to consolidate.
🔵 If You Already Hold the Stock:
Watch for price to approach ₹2,194–₹2,228.
Book partial profits if you’re short-term focused.
If it breaks above ₹2,228, consider holding more or adding for the breakout rally.
Keep trailing your stop-loss upward as the price moves.
📈 Price Behavior (Technical Summary)
Trend: Currently neutral to slightly bullish.
Volume: Not too aggressive, but steady—shows strong hands are holding.
Momentum: RSI (Relative Strength Index) near 50–55 zone on daily timeframe; neither overbought nor oversold.
Volatility: Controlled; perfect for accumulation, not short-term speculation.
📝 Final Thoughts – Human Summary
KotakBank is not in a breakout mode right now, but it’s forming a base.
If you’re a long-term investor, this is the kind of setup you wait for: clear supports, low volatility, and no hype.
The ₹2,140–₹2,175 area is your opportunity zone.
Just make sure to manage your risk below ₹2,125 and don’t go all-in at once. Gradual accumulation works best in these setups.
If it breaks ₹2,228, get ready for action. That’s your green signal for the next rally
Bitcoin’s Pullback: A Strategic Pause Before the Next Surge?After a sharp rally past the $122,000 mark, Bitcoin is now undergoing what appears to be a textbook pullback — not a sign of weakness, but a calculated pause. On the H4 chart, BTC has retraced into the $115,000–$117,000 zone, aligning perfectly with a key Fair Value Gap (FVG) left unfilled during the breakout. This zone also overlaps the Ichimoku cloud, suggesting strong dynamic support. Volume has slightly tapered off during the decline, pointing more toward profit-taking rather than a structural breakdown.
Importantly, the bullish structure remains intact: higher highs and higher lows continue to dominate, previous FVGs are respected, and the main trend remains underpinned by institutional demand from the $110,000 base. A clean breakout above $122,800 could reignite momentum toward $126,500 or even $130,000 — areas where liquidity from prior distribution zones still lingers.
NIFTY 1D TimeframeToday’s Pivot Levels & Zones
(Data sourced from Moneycontrol – based on previous day’s trading range)
Level Type Price (₹)
Pivot Point 25,196
Resistance 1 (R1) 25,271
Resistance 2 (R2) 25,330
Resistance 3 (R3) 25,405
Support 1 (S1) 25,137
Support 2 (S2) 25,062
Support 3 (S3) 25,003
🛡️ Support Levels (Potential Buy Zones)
₹25,137 (S1) – The first support level where buying interest usually emerges during mild pullbacks.
₹25,062 (S2) – A deeper support and safer buying zone if the dip extends.
₹25,003 (S3) – Significant support; break below this may signal deeper correction.
🚧 Resistance Levels (Exit or Caution Zones)
₹25,271 (R1) – Immediate ceiling where profit-taking could occur.
₹25,330 (R2) – Next hurdle; a daily close above this could spark a bullish breakout.
₹25,405 (R3) – Major resistance; a strong move past this would pave the way for higher targets.
✅ How to Trade or Invest Based on These Levels
🔹 If You’re Already Holding
Stay invested while Nifty trades above ₹25,062 (S2).
Consider trimming positions around ₹25,271–25,330 on strength.
🟢 Looking to Buy on Dips?
Enter in tranches at S1 ₹25,137, and add more at S2 ₹25,062.
If Nifty drops toward S3 ₹25,003, you can accumulate more conservatively.
🔵 Planning for a Breakout?
A clean daily close above R2 (₹25,330) can be a signal to add strongly.
Post-breakout, the next target is R3 at ₹25,405.
🛑 Risk Management
If Nifty falls below ₹25,003 (S3), consider reducing exposure—trend bias may shift downward.
🎯 Quick Strategy Summary
Buy Zones: ₹25,137 → ₹25,062
Profit Zones: ₹25,271 → ₹25,330
Breakout Target: Clear above ₹25,330 → aim for ₹25,405
Watch-Out Level: Break below ₹25,003 → trend at risk
Gold Tumbles After CPI Shock – July’s Best Buying Opportunity?Gold saw a sharp sell-off after U.S. CPI data came in hotter than expected, plunging nearly $40 to $3,327/oz in just a few hours. While this aggressive move sparked fears of a breakdown, price is now holding firm above a major H4 Fair Value Gap – a key support zone that has triggered multiple reversals in the past.
If buyers manage to defend this level, a swift rebound toward $3,375–$3,400 could be in play – especially as the dollar shows signs of cooling off after its CPI-fueled rally. However, should $3,320 give way, a deeper correction toward $3,280 becomes highly probable – and that’s when true panic may begin.
EUR/USD Slumps – Shakeout or New Sell-Off?The euro took a sharp nosedive, falling from 1.168 to nearly 1.160 in its steepest drop of the week, after hotter-than-expected U.S. CPI data shocked the market. This move reflects a classic repricing of rate expectations, as traders quickly rotated back into the dollar – the “sleeping giant” now seemingly reawakened.
Is this just a technical pullback or the beginning of deeper pain for EUR/USD bulls? With the Fed signaling it may hike again if inflation persists, the macro bias clearly favors USD strength. However, if the 1.160 support holds and we see a strong bounce with rising volume, a short squeeze could be in the making – catching late bears off guard.
Gold Faces Resistance at $3,350Gold is showing signs of exhaustion around the key psychological level of $3,350, coinciding with an unfilled Fair Value Gap. Although a bounce from $3,270 suggests buyers are active, the current price structure is forming lower highs with declining volume near the $3,325 volume profile node — a signal that upward momentum may be fading.
Unless supported by a strong macro catalyst, gold is unlikely to decisively break above $3,350 in the short term. The preferred scenario involves consolidation, minor profit-taking, and a potential retracement toward the $3,300 area. Traders should monitor volume and price reaction at the current resistance before committing to new positions.
A Break Above 149 Could Trigger a Domino EffectOANDA:USDJPY continues to exhibit a robust bullish structure, with successive Fair Value Gaps (FVGs) signaling that smart money is layering into long positions. The Ichimoku cloud is expanding, underscoring a healthy uptrend with no immediate signs of exhaustion. Notably, trading volume has surged around the 148.6–148.9 zone, suggesting a high-liquidity cluster that could soon be swept.
Should USD/JPY break decisively above the psychological resistance at 149.00, the market may trigger a “liquidation chain” — a cascading stop-loss event that could catapult price toward the 150.50 region in the next bullish wave.
This move wouldn’t merely be a technical breakout — it could act as a bull-driven acceleration trap, aiming to force momentum into new highs. Trend-following traders should be on high alert for a potential “liquidity explosion” once the 149 barrier is breached.
EUR/USD Cooling Off – Buying Opportunity Ahead?After a strong bullish run fueled by Fed rate cut bets, EUR/USD is now pulling back to the FVG zone near 1.1620 as the USD finds some footing on Powell’s hawkish remarks. Despite the pause, the bullish structure remains intact. The pair is still supported by the Ichimoku cloud and volume flow hasn’t left the market.
Ideal scenario: Look for a long setup if price tests 1.1600–1.1620 with rising volume confirmation.
Gold XAUUSD Trading Strategy on July 16, 2025Gold XAUUSD Trading Strategy on July 16, 2025:
Yesterday's trading session was in line with our prediction, the gold price corrected strongly after meeting the resistance zone of 336x. However, the support zone of 333x did not help the gold price continue to maintain the sideway range.
Basic news: The US CPI reached 2.7%, higher than the forecast of 0.1% and higher than the previous 0.3%; positively affecting the USD, helping the gold price to decrease sharply.
Technical analysis: Currently, the gold price has broken the sideway range of 3335 - 3375 and is likely to compress in the 3300 area. RSI of the H1, H4 and D1 time frames are moving towards the buying zone. This could be a good long-term trading opportunity for us.
Important price zones today: 3338 - 3343, 3350 - 3355 and 3300 - 3305.
Today's trading trend: SELL (BUY hold).
Recommended orders:
Plan 1: SELL XAUUSD zone 3341 - 3343
SL 3346
TP 3338 - 3328 - 3318 - 3308.
Plan 2: SELL XAUUSD zone 3353 - 3355
SL 3358
TP 3350 - 3340 - 3330 - 3300.
Plan 3: BUY XAUUSD zone 3300 - 3302
SL 3297
TP 3305 - 3315 - 3335 - 3350 - Open (small volume).
Wish you a safe, favorable and profitable trading day.🌟🌟🌟🌟🌟
Mastering Multi Time Frame Analysis | Swing and Intraday TradingWhether you're a price action trader or rely on indicators, mastering Multi Time Frame (MTF) Analysis can transform your swing and intraday trading decisions. In this video, I break down how to use MTF effectively to align your entries, spot fakeouts, and trade with higher conviction.
Nifty 1D Timeframe 📍 Current Price: Around ₹25,140
📊 Intraday Range: ₹25,120 (Low) – ₹25,260 (High)
🛡️ Support Levels (Buy-on-Dip Zones)
These are the key levels where buyers may step in:
✅ Support 1 (S1): ₹25,100
Recent intraday low
If Nifty holds this, a bounce is likely
✅ Support 2 (S2): ₹25,020 – ₹25,050
Important daily support zone
Ideal for safe, staggered buying if market dips
✅ Support 3 (S3): ₹24,900 – ₹24,950
Strong technical base
If this breaks, it can trigger more selling pressure
🚧 Resistance Levels (Profit-Booking / Selling Zones)
These are levels where the rally might face hurdles:
🔼 Resistance 1 (R1): ₹25,265 – ₹25,280
Current ceiling zone
Needs strong volume to cross this
🔼 Resistance 2 (R2): ₹25,333 – ₹25,350
Key short-term resistance
If crossed, can push Nifty toward a breakout
🔼 Resistance 3 (R3): ₹25,420 – ₹25,450
Major breakout level
Closing above this could trigger rally toward ₹25,600+