BUY TODAY SELL TOMORROW for 5%DON’T HAVE TIME TO MANAGE YOUR TRADES?
- Take BTST trades at 3:25 pm every day
- Try to exit by taking 4-7% profit of each trade
- SL can also be maintained as closing below the low of the breakout candle
Now, why do I prefer BTST over swing trades? The primary reason is that I have observed that 90% of the stocks give most of the movement in just 1-2 days and the rest of the time they either consolidate or fall
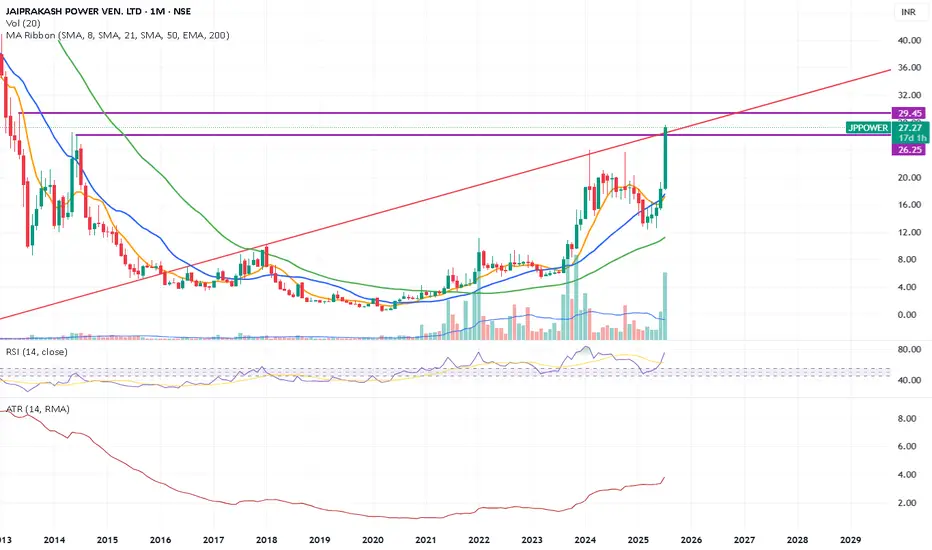
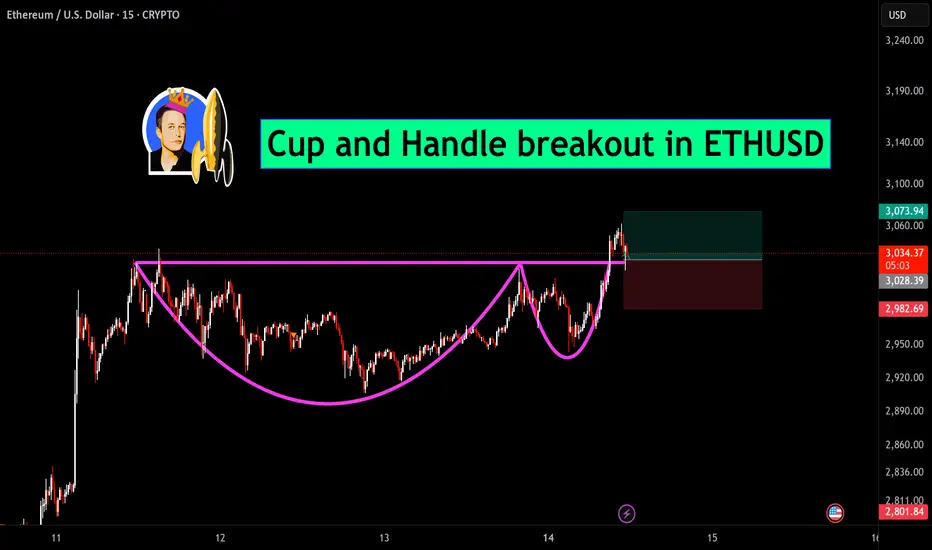
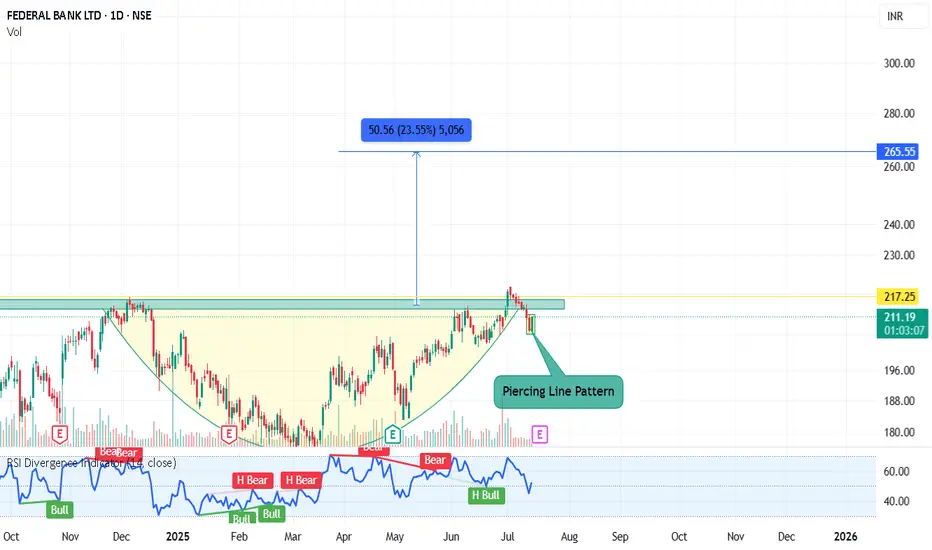
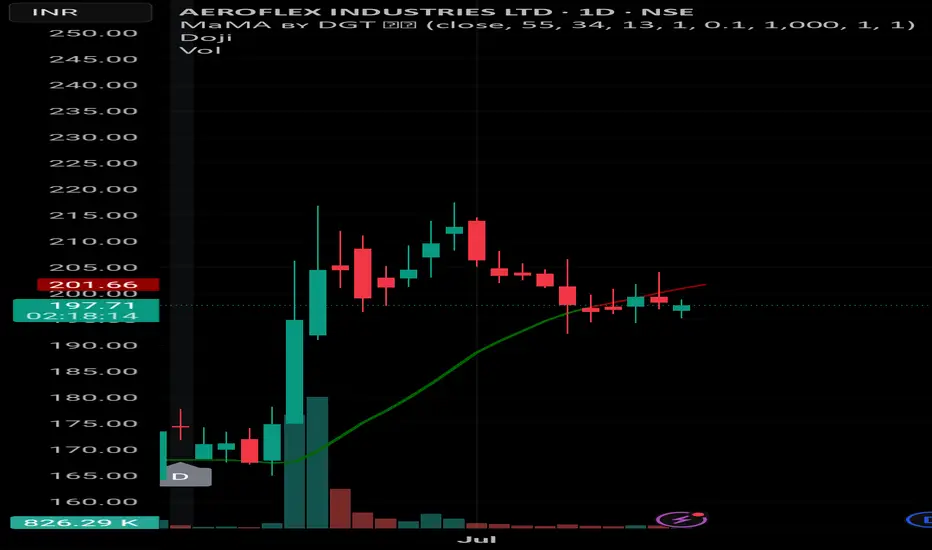
Cup and Handle Breakout in EIEL
BUY TODAY SELL TOMORROW for 5%
Community ideas
BUY TODAY SELL TOMORROW for 5%DON’T HAVE TIME TO MANAGE YOUR TRADES?
- Take BTST trades at 3:25 pm every day
- Try to exit by taking 4-7% profit of each trade
- SL can also be maintained as closing below the low of the breakout candle
Now, why do I prefer BTST over swing trades? The primary reason is that I have observed that 90% of the stocks give most of the movement in just 1-2 days and the rest of the time they either consolidate or fall
Trendline Breakout in ANANDRATHI
BUY TODAY SELL TOMORROW for 5%
Cup and Handle breakout in ETHUSDA classic Cup and Handle pattern has been formed in ETHUSD. The price has successfully broken above the neckline, confirming the breakout. Currently, it's retesting the breakout zone as support — a healthy sign of strength. If this level holds, a further bounce and continuation to the upside is expected.
XAUUSD at risk of dropping – is gold going to fall further?XAUUSD is currently trading around 3,355, close to the resistance at 3,375. After a strong rally, gold is facing difficulty at this level and is likely to experience a correction. A symmetrical triangle pattern is forming, and if gold fails to break through the resistance, the price could drop to 3,301 or 3,255.
In terms of news, the USD and U.S. bond yields are holding steady, with stable U.S. employment data and no clear signals from the Fed on interest rate cuts. Additionally, the World Gold Council warns of a potential correction in gold if global political tensions ease or if USD and bond yields continue to rise.
Sellers are starting to take control, and if the support at 3,320 is broken, gold could fall further. Keep a close eye on the market!
JPPOWER Breaks 11-Year High – Eyes Set on 74 & 84📢 #Update:
#JPPOWER
🔹 As per earlier analysis, the stock moved from 5.65 to 24, followed by a healthy retracement to 12.36, successfully retesting the breakout from the Inverse Head & Shoulders pattern.
🔹 Post-retest, the stock resumed its uptrend and has recently hit a high of 26.85. It is currently trading just below a key resistance level at 26.60.
📌 Key Level to watch:
Monthly close above 26.60 may open the path for potential long-term levels around 74 and 84, subject to broader market conditions and trend sustainability.
🔍 This is a technical observation and not investment advice. Please consult a SEBI-registered financial advisor before making any investment decisions.
#TechnicalAnalysis | #StockUpdate| #ChartPatterns
PB FINTECH Swing Trade (15% upside)If Nifty holds current levels ie. 25,000 then there are high chances that PB FINTECH will continue its uptrend and will make a new high.
Currently it is at a buying zone, you can make positions as per your risk.
Sellers are also trapped recently which can start next up-move.
With 1:5 RR and >15% upside potential.
Thanks and let me know if you have any questions regarding this setup in comments.
price increase, gold price towards 3385Plan XAU day: 14 July 2025
Related Information:!!!
An already fragile global risk sentiment has deteriorated further in response to renewed tariff threats from US President Donald Trump targeting two of the country’s major trade partners—Mexico and the European Union. In separate letters sent on Saturday to European Commission President Ursula von der Leyen and Mexican President Claudia Sheinbaum, President Trump announced the potential for new tariffs, adding to more than 20 similar notices issued since last Monday.
This latest development has dampened investor appetite for riskier assets, as reflected in the broadly weaker tone across global equity markets, and may continue to provide support for safe-haven assets such as gold. However, mixed signals regarding the Federal Reserve’s near-term interest rate trajectory are preventing XAU/USD bulls from making aggressive moves or extending the recent rally to multi-week highs
personal opinion:!!!
Trade tensions between two major regions: the US and the EU, have made gold prices positive again, and market concerns that DXY and EURO will restrain each other's value.
Important price zone to consider : !!!
resistance zone point: 3385 zone
Sustainable trading to beat the market
Piercing line pattern Federal BankPiercing line pattern seen on Federal Bank Chart
Price could reverse from here and again re-test the breakout level of 217.
If price sustain over breakout level, there are lot of chance to move up.
Keep watching..............
This is only for educational purpose and no any recommendation of trade.
TON Symmetrical Triangle Pattern (~170% Upside in sight!)🚨 #OnRadar 🚨
#TONUSD (#TonCoin)
CMP: $3.0244
📍 Support Zone: $2.6684 – $2.4833
📊 Technical Setup: #Toncoin is once again forming a Symmetrical Triangle pattern on the long-term chart — the same structure that previously triggered a breakout from $2.33 to $8.28 with no retest.
Currently, TON is retesting the breakout zone ($2.6684–$2.4833), setting up a high-probability entry for the next potential move.
🎯 Targets:
First: $4.45 – $4.49 (+46% to +80%)
Extended: $8.28++ (up to +170% from CMP) — if trend sustains
⚠️ Watch for breakout confirmation to validate momentum before entering.
#TON | #TonCoin | #Altcoins | #CryptoCharts | #TechnicalAnalysis | #SymmetricalTriangle
IFCI Price Action## Trend Overview
IFCI has shown significant volatility in recent months. After a strong rally earlier in the year, the stock has entered a corrective phase, with the price currently hovering around ₹60.58–₹64.50 as of July 14, 2025. The broader trend over the past year has been negative, but the last quarter displayed a sharp upward move, followed by some consolidation and profit booking.
## Price Action & Momentum
- **Short-Term:** The stock is consolidating after a steep rise in the last three months, where it gained nearly 49%. The recent pullback reflects profit-taking and market caution.
- **Medium-Term:** Despite the recent correction, the price remains above major moving averages, indicating that the medium-term uptrend is still intact.
- **Long-Term:** IFCI is down about 12% over the past year, but up over 534% in three years, highlighting its high volatility and cyclical nature.
## Technical Indicators
- **Moving Averages:** The daily price is above its 50-day and 200-day moving averages, supporting a positive medium-term outlook. Shorter-term averages are converging, suggesting a pause or consolidation.
- **Relative Strength Index (RSI):** The RSI is in the overbought zone, indicating potential for further cooling or sideways movement before the next trend emerges.
- **MACD:** The MACD indicator is positive, but momentum has slowed, suggesting the rally may be losing steam.
- **Volatility:** The stock displays high volatility, with a beta above 2, indicating larger swings compared to the broader market.
## Support and Resistance
- **Immediate Support:** Around ₹60, where recent buying interest has emerged.
- **Major Support:** Near ₹55, which aligns with the 50-day moving average and a previous breakout zone.
- **Immediate Resistance:** Near ₹65, which coincides with recent swing highs.
- **Major Resistance:** The 52-week high at ₹91.40.
## Volume and Sentiment
- Recent sessions have seen increased volume on down days, reflecting profit booking and cautious sentiment.
- Long-term sentiment remains speculative, with traders reacting quickly to momentum shifts and news.
## Summary
IFCI remains a high-beta, volatile stock with a history of sharp rallies and deep corrections. The current daily chart shows consolidation after a strong uptrend, with the price holding above key supports. As long as the stock remains above its 50-day moving average, the medium-term bullish structure is intact. However, the overbought technical indicators and recent profit-taking suggest that short-term movements may remain range-bound or slightly negative until a clear breakout or breakdown occurs. Risk management is crucial given the elevated volatility.
EUR/USD Weakens Amid Trade Tensions and Fed OutlookThe EUR/USD pair continues to decline under the pressure of trade tensions and expectations surrounding the U.S. Federal Reserve's monetary policy. This week, the U.S. decision to impose new tariffs on certain products has heightened market uncertainty, weakening the euro and pushing the price lower.
On the other hand, the continued strength of the U.S. dollar, supported by solid economic data and expectations of a restrictive Fed policy, has worsened the decline of the European currency.
Technically, EUR/USD appears to be breaking through support levels, with the risk of further declines if the current trend continues.
GODFRYPHLP Price Action## Trend Overview
Godfrey Phillips India (GODFRYPHLP) is showing a volatile but overall bullish structure on the daily chart. The stock recently hit an all-time high near ₹9,645 and is currently trading around ₹8,687. After a strong rally over the past year, the price has entered a consolidation phase, with short-term corrections and profit booking visible.
## Price Action & Momentum
- The stock has gained over 100% in the last year, reflecting strong long-term momentum.
- In the short term, the price has pulled back from its peak and is trading below key resistance levels, indicating some selling pressure.
- Despite the pullback, the broader uptrend remains intact as the price is still above major moving averages.
## Technical Indicators
- **Moving Averages:** The daily price is above its 50-day and 200-day simple moving averages, supporting a positive long-term bias. Shorter-term averages (20-day and 50-day) are converging, suggesting consolidation.
- **Relative Strength Index (RSI):** The RSI is in the neutral zone, indicating neither overbought nor oversold conditions. This points to a potential pause or sideways movement before the next trend.
- **MACD:** The MACD indicator has shown a weak sell signal, but the overall momentum loss is mild, not confirming a strong reversal.
- **Bollinger Bands:** The price is in the lower half of the bands, suggesting a cooling-off period after a sharp rally. Volatility remains high.
## Support and Resistance
- **Immediate Support:** Around ₹8,500, where the stock has found buying interest in recent sessions.
- **Major Support:** Near ₹8,000, which coincides with the 50-day moving average and a previous breakout zone.
- **Immediate Resistance:** Near ₹8,900 to ₹9,000, which aligns with recent swing highs.
- **Major Resistance:** The all-time high at ₹9,645.
## Volume and Sentiment
- Recent sessions have seen higher volumes on down days, indicating profit booking.
- Long-term sentiment remains positive, but short-term traders are cautious due to the recent correction and volatility.
## Summary
GODFRYPHLP remains in a strong uptrend on the daily timeframe, but the current phase is marked by consolidation and profit-taking after hitting record highs. The price is holding above key supports, and as long as it stays above the 50-day moving average, the broader bullish structure is intact. Short-term movements may remain range-bound with a slight downward bias until a clear breakout above resistance or breakdown below support occurs. Risk management is advised due to elevated volatility.
Bank Nifty Price Action# BANKNIFTY Hourly Chart Price Analysis
## Overview
On the hourly chart, BANKNIFTY is exhibiting a cautious and volatile structure, with technical indicators suggesting a mix of short-term weakness and potential for intraday momentum. The index is trading near key support and resistance levels, and traders are closely watching for breakouts or breakdowns to determine the next directional move.
- **Above 57,070:** Intraday bullish momentum is likely.
- **Below 56,900:** Weakness and potential downside may emerge.
- **Holding above 55,750:** Maintains a positive undertone for the broader trend.
## Technical Indicators
- **Moving Averages:** Most short-term and medium-term moving averages are signaling a bearish bias, with prices trading below the 5, 10, 20, and 50-period averages.
- **RSI (Relative Strength Index):** Hovering in the neutral to slightly bearish zone, indicating lack of strong momentum but not yet oversold.
- **MACD:** Shows bearish crossover, supporting the short-term negative bias.
- **Stochastic Oscillator:** Indicates overbought conditions on some timeframes, cautioning against aggressive long positions.
- **ATR (Average True Range):** High, reflecting elevated volatility and potential for sharp intraday swings.
## Price Action Insights
- The index recently broke below a short-term ascending pattern, increasing the risk of further declines if support levels are breached.
- Intraday trading is expected to remain volatile, with sharp moves likely around key pivot levels.
- Sentiment is cautious due to global factors and domestic flows, but the downside is cushioned by institutional buying on dips.
## Trading Outlook
- **Bullish Scenario:** Sustained move above 57,070 with strong volume could open up targets towards 57,300 and 57,500.
- **Bearish Scenario:** Failure to hold above 56,900 may see the index test 56,500 and lower supports.
- **Neutral/Bounce Play:** Sideways consolidation is possible if the index holds between 56,900 and 57,070, with traders advised to wait for a clear breakout.
**Note:** High volatility and mixed signals call for disciplined risk management and quick decision-making on intraday trades.
Gold Analysis and Trading Strategy | July 14✅Gold opened with a gap up today, indicating a strong bullish trend, with the current price around 3370. After reaching a high of 3374 in the early session, gold is still consolidating at these high levels, awaiting buying pressure. Due to the gap up and subsequent rise, the short-term trend is likely to experience a gap fill. Additionally, considering the rapid rise, if a drop occurs during the European session, a pullback may follow. The upward curve is smooth, and the bullish momentum is strong, with the market still dominated by bulls. Therefore, today we should focus on strong support levels for buying opportunities, with the key entry point being around 3345-3350.
✅On the 1-hour chart, the moving averages continue to show a golden cross, indicating a bullish arrangement. In a strong market, a series of consecutive bearish candles can damage the upward pattern, while too many bullish candles can disrupt a downtrend. Therefore, attention must be paid to the strength of the candlestick patterns today. The current support level is near 3350, with further support at 3345. For the price to maintain this bullish trend, it should not fall below 3345 today. If gold retraces to 3350, it remains a buying opportunity.
🔴 Key Resistance Levels : The short-term resistance is in the range of 3392-3400. If this area is broken, gold could continue to rise.
🟢 Key Support Levels: Key support is at 3350, with further support at 3345.
✅ Trading Strategy Reference:
🔻 Short Position Strategy:
🔰When gold rebounds to around 3392-3395, consider selling in parts, with a stop loss of 8-10$ and a target of 3370-3360. If this level is broken, the next target would be 3350.
🔺 Long Position Strategy:
🔰When gold pulls back to around 3345-3350, consider buying in parts, with a stop loss of 10 points and a target of 3365-3385. If the price breaks through, the next target would be 3395.
🔥Trading Reminder: Trading strategies are time-sensitive, and market conditions can change rapidly. Please adjust your trading plan based on real-time market conditions. If you have any questions or need one-on-one guidance, feel free to contact me.
AEROFLEX INDUSTRIES LTD – Short-Term Swing Setup🟢 AEROFLEX INDUSTRIES LTD – Short-Term Swing Setup
📊 Chart: Daily (1D)
📍 CMP: ₹198.33
📅 Date: July 14, 2025
---
🔍 Technical View:
Price bounced after short correction, holding above 20 EMA.
Volume spike on prior breakout shows buyer interest.
UP signal printed again — showing short-term strength.
---
🎯 Trade Plan:
Entry Zone: ₹195–198
Target 1: ₹210
Target 2: ₹220 (partial profit booking suggested)
Stoploss: ₹191 (closing basis below 20 EMA)
📋 Action Plan:
✅ If price sustains above ₹200 with volume — hold for full target.
⚠️ If price hovers below ₹195 for too long — exit or re-evaluate.
❌ If closing below ₹191 — exit completely (setup invalidated).
🔁 Trail SL to ₹198 once ₹210 is hit, to lock partial profit.
⚠️ Disclaimer: This is purely educational and not investment advice. I am not a SEBI-registered advisor. Do your own analysis or consult a financial expert before trading.
Anant Raj Ltd ₹ 570 1.55% 14 Jul 12:50 p.m.Anant Raj Ltd
₹ 570
1.55%
14 Jul 12:50 p.m.
#chart_sab_kuch_bolta_hai*
If price breaks above Rs 582 . in daily timeframe, then 1st Target is RS 600 to 604 2nd target is RS 650 to RS 655 Stoploss your own.
DISCLAIMER:
I am not a SEBI-registered advisor. The content shared, including charts, ideas, and analysis, is purely for educational and informational purposes only. This should not be considered as financial or investment advice. Please do your own research or consult with a SEBI-registered professional before making any trading or investment decisions. I will not be responsible for any losses incurred.