


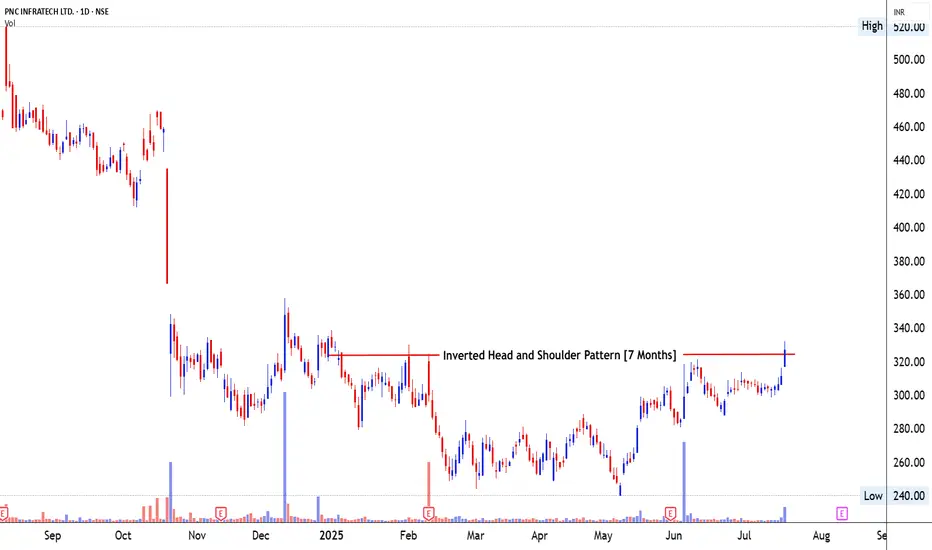
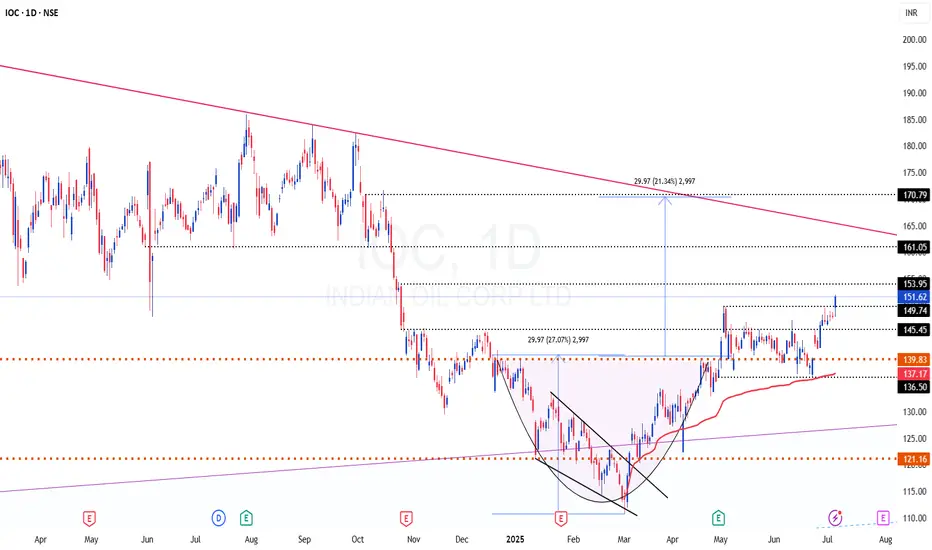
PNC Infra- Inverted Head and Shoulder Pattern1⃣ Pattern Structure & Breakout Development 📈
📐 Pattern Identification : Inverted Head and Shoulder Pattern – a powerful bottom reversal pattern, signaling the end of a prolonged downtrend and readiness for upside expansion.
⏳ Time Taken in Formation : The pattern matured over 7 months (from Dece


 JPY
JPY CHF
CHF CNY
CNY


