JatinManani
In the Weekly Chart of KOPRAN , we can see that, it is at decision making point. Possible momentums are shown in chart.
In the Weekly Chart of BIOCON , we can see that, it is about to give Inverted Head & Shoulder. Expected momentum are shown in chart.
In the Weekly Chart of IRCTC , we can see that, it is about to give Inverted Head & Shoulder. Expected momentum are shown in chart.
In the Weekly Chart of OAL , we can see that, it is about to give Cup & Handle breakout. Let it retest and spend one or two weeks and then give a strong breakout. Expected momentum are shown in chart.
In the Weekly Chart of PFC , we can see that, it is at decision making point. Possible momentums are shown in chart.
In the Weekly Chart of FAIRCHEMOR , we can see that, it is shrinking from the Top. Soon, we will se momentum in it. Possible momentums are shown in chart.
In the Weekly Chart of TMB , we can see that, it is about to give Cup & Handle breakout. Expected momentum are shown in chart.
In the Weekly Chart of MARUTI , we can see that, Inverted Head & Shoulder failed. It has now created 2 inside candles. it will soon take a any of the side momentume. My expected momentum is shown in chart.
In the Weekly Chart of PVRINOX , we can see that, it is about to give Cup & Handle breakout. Possible momentums are shown in chart.
In the Weekly Chart of TATAMOTORS , we can see that, it is at decision making point. Possible momentums are shown in chart.
In the Weekly Chart of LTTS , we can see that, it has retested properly and now its ready for up move. Expected momentum is shown in chart.
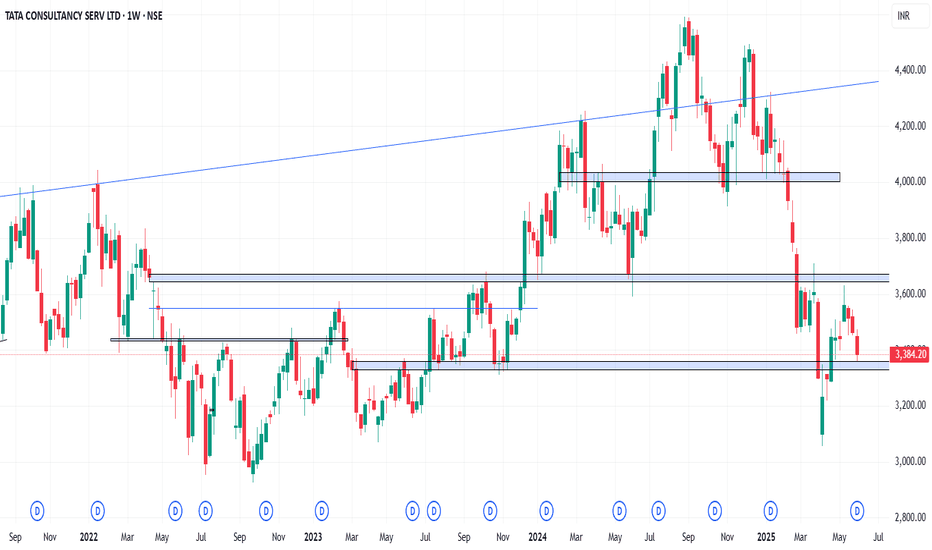
In the Weekly Chart of TCS , we can see that, it has come to test support. Let it test properly and then we can make a trade plan.
In the Weekly Chart of SHRIRAMFIN , we can see that, it is ready for Cup & Handle breakout. Let it retest and then enter with SL and Targets. Expected momentum is shown in chart.
In the Weekly Chart of EMAMILTD , we can see that, it is at decision making point. Expected momentums are shown in chart.
In the Weekly Chart of TATAMOTORS , we can see that, it has retested properly and now its ready for up move. Expected momentum is shown in chart.
In the Weekly Chart of MAHAPEXLTD , we can see that, it is at decision making point. Expected momentums are shown in chart.
In the Weekly Chart of CROMPTON, we can see that, Bullish momentum is started. It has taken a bounce back from 300-320. Also, it is leading towards Big Cup & Handle breakout. Expected momentum is shown in chart.
In the Weekly Chart of HINDUNILVR , we can see that, it can give a Cup & Handle breakout at 2400 level. Expected momentum is shown in chart.


