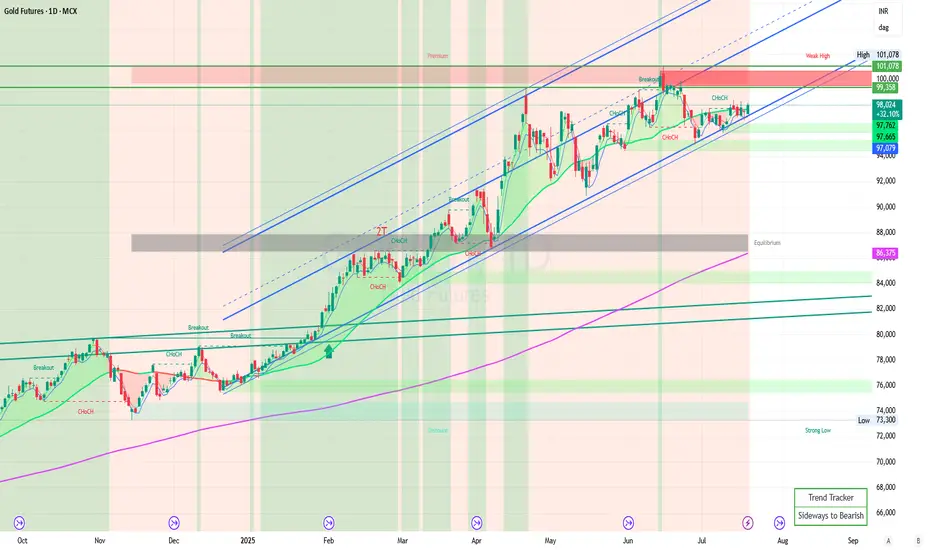
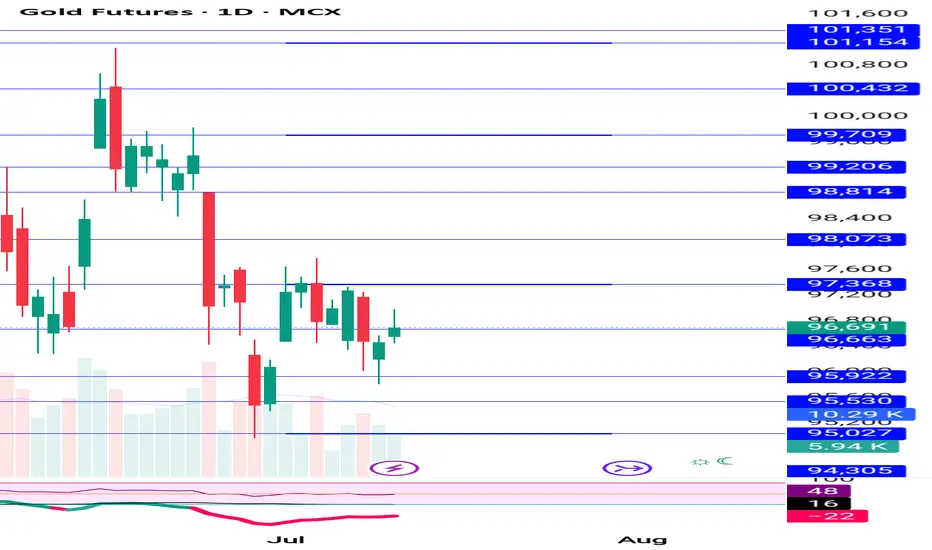
Gold Daily Trend with Ascending Channel
MCX:GOLD1!
A gold daily time frame chart with an ascending channel is a technical analysis setup that shows the price movement of gold over a daily period, forming a pattern known as an ascending channel.
Key Features of an Ascending Channel:
- Trendline Connection: The channel is created
Related commodities
Good mcx updated levels sell below 97400 , buy above 98100How My Harmonic pattern projection Indicator work is explained below :
Recent High or Low :
D-0% is our recent low or high
Profit booking zone: D13% -D15% is
range if break them profit booking start on uptrend or downtrend but only profit booking, trend not changed
SL reversal zone : SL 2
GOLD tug-of-war between buyers and sellers near key levelsCurrently, the price hovers near ₹78,489, slightly below the ₹78,800 resistance. If bulls can decisively break above ₹78,800 and hold, the next resistance targets are clearly demarcated at:
₹79,500 — minor resistance and previous support-turned-resistance.
₹80,000 — psychological round level and a
Good sold at 97750 today booked at 96860 , sell riseHow My Harmonic pattern projection Indicator work is explained below :
Recent High or Low :
D-0% is our recent low or high
Profit booking zone: D13% -D15% is
range if break them profit booking start on uptrend or downtrend but only profit booking, trend not changed
SL reversal zone : SL 2
Gold trading in narrow range sell on rise will continue How My Harmonic pattern projection Indicator work is explained below :
Recent High or Low :
D-0% is our recent low or high
Profit booking zone: D13% -D15% is
range if break them profit booking start on uptrend or downtrend but only profit booking, trend not changed
SL reversal zone : SL 2
[Commodity] Intraday Gold Buy IdeaNote -
One of the best forms of Price Action is to not try to predict at all. Instead of that, ACT on the price. So, this chart tells at "where" to act in "what direction. Unless it triggers, like, let's say the candle doesn't break the level which says "Buy if it breaks", You should not buy at all.
Gold Struggle – Bearish Grip Tightens Near ₹77,500Unless the price decisively closes above ₹78,000–₹78,200, the current movement should be considered a pullback within a larger downtrend. A renewed breakdown below ₹77,400 may trigger fresh selling pressure, with the next key downside level likely near ₹76,900.
Trend: Bearish
Resistance: ₹78,000 –
Gold as said earlier negative move , sell on rise 95100, 94300, How My Harmonic pattern projection Indicator work is explained below :
Recent High or Low :
D-0% is our recent low or high
Profit booking zone: D13% -D15% is
range if break them profit booking start on uptrend or downtrend but only profit booking, trend not changed
SL reversal zone : SL 2
See all ideas
Summarizing what the indicators are suggesting.
Neutral
SellBuy
Strong sellStrong buy
Strong sellSellNeutralBuyStrong buy
Neutral
SellBuy
Strong sellStrong buy
Strong sellSellNeutralBuyStrong buy
Neutral
SellBuy
Strong sellStrong buy
Strong sellSellNeutralBuyStrong buy
A representation of what an asset is worth today and what the market thinks it will be worth in the future.
Displays a symbol's price movements over previous years to identify recurring trends.
Frequently Asked Questions
The current price of Gold Futures is 16,144 JPY — it has risen 0.34% in the past 24 hours. Watch Gold Futures price in more detail on the chart.
The volume of Gold Futures is 9.67 K. Track more important stats on the Gold Futures chart.
Open interest is the number of contracts held by traders in active positions — they're not closed or expired. For Gold Futures this number is 21.51 K. You can use it to track a prevailing market trend and adjust your own strategy: declining open interest for Gold Futures shows that traders are closing their positions, which means a weakening trend.
Buying or selling futures contracts depends on many factors: season, underlying commodity, your own trading strategy. So mostly it's up to you, but if you look for some certain calculations to take into account, you can study technical analysis for Gold Futures. Today its technical rating is strong buy, but remember that market conditions change all the time, so it's always crucial to do your own research. See more of Gold Futures technicals for a more comprehensive analysis.