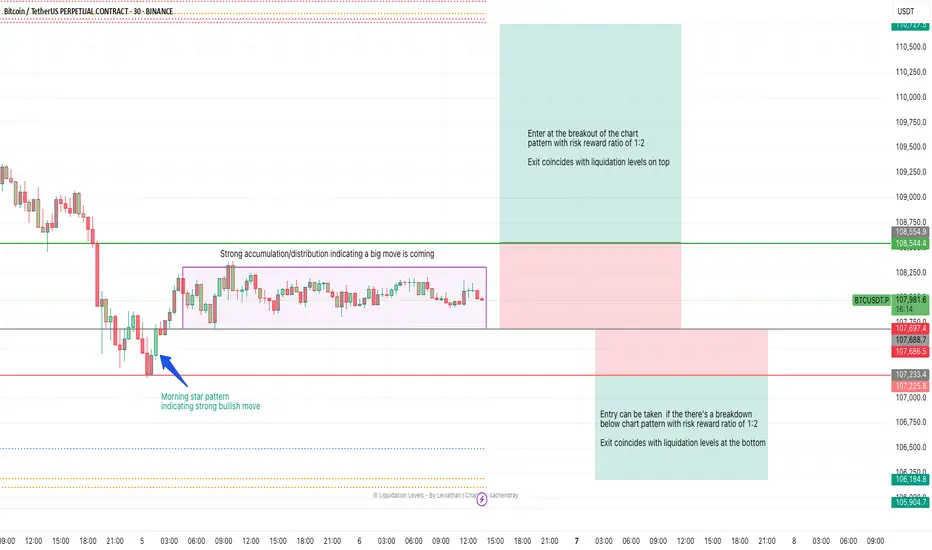
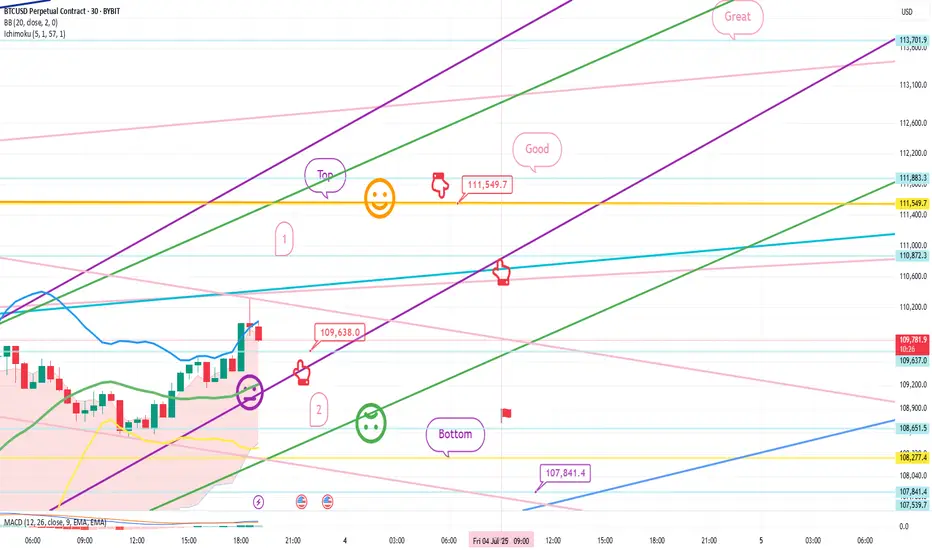
BTCUSDT – Accumulation Breakout Setup (30-min Chart)This setup highlights a potential breakout trade on the BTCUSDT perpetual contract, based on clear price action and chart patterns:
• Morning Star Pattern: A strong bullish reversal signal formed at the recent low, suggesting the possibility of an upward move.
• Accumulation/Distribution Zone: Price has consolidated within a well-defined range, indicating accumulation or distribution and foreshadowing a significant move.
Breakout Entry:
• Long Position: Enter on a confirmed breakout above the range, targeting a minimum risk-reward ratio of 1:2. The exit aligns with the upper liquidation levels.
• Short Position: Enter if price breaks down below the range, also with a 1:2 risk-reward ratio. The exit coincides with the lower liquidation levels.
Key Levels:
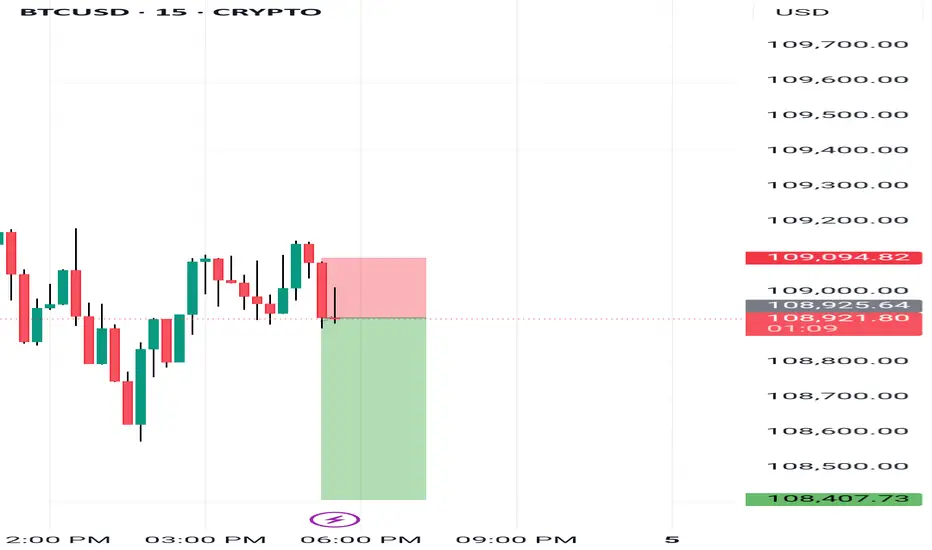
• Long Trigger: Break above 108,544.4 USDT.
• Short Trigger: Break below 107,233.4 USDT.
Risk Management : Both entries are structured with clear stop-loss and take-profit levels, ensuring disciplined trade management.
This setup is ideal for traders watching for volatility expansion after a period of sideways price action, with well-defined risk and reward parameters.
Crypto market
BTC/USD Bullish Reversal Breakout Pattern BTC/USD Bullish Reversal Breakout Pattern 🚀
Technical Analysis:
🔹 Trend Reversal: The chart shows a clear inverse head and shoulders pattern highlighted with orange circles — a strong bullish reversal signal after a downtrend.
🔹 Breakout Zone: The neckline resistance around 108,000 USD has turned into support (marked as “SU00QT” due to a typo, assumed to be “SUPPORT”). Price action is consolidating just above this zone.
🔹 Trendline Support: The upward blue trendline confirms bullish structure, with price forming higher lows. Recent price action is bouncing off this trendline, showing strength.
🔹 Bullish Confirmation: Green arrows indicate strong bullish rejections from key levels, aligning with breakout retests.
🔹 Target Projection: The measured move from the inverse head and shoulders pattern projects a target towards the 114,000 USD resistance zone 📦 highlighted above, suggesting a potential 5-6% upside move 📊.
Conclusion: As long as price holds above the 108,000 support zone and the ascending trendline, BTC/USD remains bullish with potential continuation towards 114,000 USD. A breakout above minor consolidation could trigger a strong bullish rally 💥.
🛑 Invalidation: A sustained break below 106,000 USD would invalidate the bullish structure and may lead to further downside.
Bitcoin (BTCUSDT) Weekend 4H Analysis – RSI Fakeouts, VolumeToday is Saturday, and with global markets closed, volume across the crypto space is expected to remain limited. As a result, we shift our focus to the 4-hour timeframe, where more actionable signals may appear.
🔸 Key 4H Observations:
The latest pullback was accompanied by rising volume, which is notable — however, it's not yet sufficient for me to open a short position, as it lacks a full confirmation.
We are closely watching the support at 105408.65, which could provide a low-risk opportunity to test a long position if respected.
🔸 Important RSI Signal:
In uptrends, when RSI briefly dips below the 30 zone and quickly recovers, it often acts as a bullish fakeout — and that's exactly what we saw recently.
After this RSI fakeout, BTC bounced off the support near 105408.65 and surged toward 110221.73 — further validating that support.
This retest of 105408.65 will be critical. If price reacts again at that level, I’ll consider two possible strategies:
A low-risk short if we see a rejection with confirmation.
An early-entry long if price fakes below the level and recovers with strength.
⚠️ Weekend Trading Tip:
Since it’s the weekend, liquidity is thinner — make sure to adjust your risk accordingly. Keep in mind:
Primary long entry remains above 110221.73 (the confirmed breakout zone).
Risky short consideration is only valid around 105408.65 and must be supported by volume and structure.
✅ Capital Management Reminder:
Whether you're trading potential fakeouts or preparing for breakout setups, be disciplined with your capital. Weekend volatility can give false signals — stay patient and wait for confirmation.
#BTCUSDT #BitcoinAnalysis #CryptoTrading #4HChart #RSIStrategy #FakeoutSetup #WeekendTrading #CryptoVolume #TechnicalBreakout #TradingViewCrypto
$Btc Summer Scenarios: Breakout or Breakdown?Bitcoin is currently forming higher lows, indicating bullish intent — but strong resistance around $110.6K continues to hold.
There are 3 key scenarios developing:
1. Double Top Formation: If BTC faces rejection again near $110.5K, a double top may form, leading to a potential drop.
2. Bullish Breakout: A successful breakout above both resistance levels could push BTC toward $116K–$120K.
3. Bearish Breakdown: If rejection happens earlier without retesting, BTC might crash directly to a lower low around $95K–$96K.
RSI indicates underlying strength, but until a decisive breakout or rejection confirms, traders should remain cautious and patient.
Intraday Long Setup | July 4th 2025 | Valid Until Daily ClosePrice retraced to a strong pivot zone.
Structure remains bullish with potential for continuation after pullback.
Tight risk control.
Watch for price reaction within the red zone. Entry only if confirmation appears
The setup expires at end of the daily candle close.
Ethereum levels,try to sell near resistance 2150-220 buying areaHow My Harmonic pattern projection Indicator work is explained below :
Recent High or Low :
D-0% is our recent low or high
Profit booking zone: D13% -D15% is
range if break them profit booking start on uptrend or downtrend but only profit booking, trend not changed
SL reversal zone : SL 23% and SL 25% is reversal zone if break then trend reverse and we can take reverse trade
Target : T1, T2, T3, T4 and .
Are our Target zone
Bitcoin levels buy near support sell near resistance also How My Harmonic pattern projection Indicator work is explained below :
Recent High or Low :
D-0% is our recent low or high
Profit booking zone: D13% -D15% is
range if break them profit booking start on uptrend or downtrend but only profit booking, trend not changed
SL reversal zone : SL 23% and SL 25% is reversal zone if break then trend reverse and we can take reverse trade
Target : T1, T2, T3, T4 and .
Are our Target zone
BTC - new ATH will happenIn the month of April, I clearly pointed out BTC will take support and will move upside only and all news are favorable for up move. In less than 3 months we are seeing the expected up move. From July first week I am expecting BTC to make new ATH and T1 is near 118K and T2 is around 130K and BTC could even see 145 K easily in this year 2025. All the news coming from US are only indicating higher levels for BTC. Avoid all other Alt coins and stay long in BTC for few more weeks to see the biggest profits in 2025.
SOLUSD Fake Breakout & Reversal Setup | 15-Min ChartAfter a fake breakdown below the recent support, Solana (SOLUSD) is showing signs of reclaiming strength. Price has retested the $149.97 level, which acted as a key zone of liquidity, before resuming its upward march.
This move suggests that the earlier dip was a liquidity hunt, shaking out weak hands before a potential reversal.
📈 A bounce from $149.97 can trigger a bullish move toward the $151.35–$151.77 resistance zone.
Key Levels:
🔹 Retest Support: $149.97
🔹 Resistance Zone: $151.35–$151.77
🔹 Bullish Confirmation: Break and close above $151.77 with volume
Watch price action closely around $149.97 for confirmation of the reversal.
BTCUSDT Update – Testing Major Resistance | Volume Insights & TSince yesterday, Bitcoin hasn’t made any significant moves, but it's now testing a critical resistance level at 110221.73, where price has started to pull back slightly.
🧭 Chart Context:
On the left side of the image, we observe the daily timeframe, and on the right side, the 1-hour chart gives us microstructure clarity.
On the 1H chart, we can clearly see that volume increased during the move toward resistance, and now, as price consolidates, volume is decreasing — a healthy sign of a bullish pause rather than a reversal.
While this detailed volume behavior isn’t visible on the daily chart, what we do notice there is that BTC has formed a higher high and higher low, making this pullback a natural and expected correction within an uptrend.
📌 What We Need Now:
As price revisits 110221.73, we need to see renewed volume and momentum on lower timeframes to confirm a valid long entry.
Remember: this zone is not just any resistance — it’s a key HWC (Higher Weekly Close) level that holds long-term significance.
So price action may look volatile on lower timeframes, but it's perfectly normal from a daily perspective.
🎯 Execution Plan:
Personally, I’ll be tracking this setup primarily on the 4H chart, and I’ll consider placing a wider stop-loss to accommodate potential whipsaws near resistance.
If my stop is hit, it will likely signal that we’ve entered a deeper correction phase, and I’ll then wait for a fresh long setup aligned with my strategy.
This mindset protects me from getting stopped out prematurely during normal pullbacks.
📉 No Short Setup for Now:
There is no compelling short scenario at this point. I’ll wait to see if the market delivers a clean rejection with a confirmed leg down before considering any short trades.
📈 Summary:
BTC is approaching a critical resistance zone with declining volume during pullback — a healthy sign. A breakout with rising volume will activate a long setup. Until then, it's all about waiting with structure, risk control, and patience.
#BTCUSDT #BitcoinUpdate #CryptoAnalysis #ResistanceTest #BreakoutSetup #HWCLevel #VolumeAnalysis #PriceAction #DailyChart #4HStrategy #TradingViewAnalysis #CryptoOutlook #RiskManagement
BITCOIN FORMED TWO PATTERNHere i drawn two pattern
1 diamond cut pattern which i call kite which is reversal patten and here you can see clearly that reversal fron exacly at its ratio.
color WHITE
2 There is symmetrical triangle pattern which is trend following pattern but her minor trend change is visible whenever it break resistance mentioned here we can expect bigger move .
Long only at sopport and breakout this is not my buy/sell call.
3 A trend line of hourly support lini in BLUE.
[SeoVereign] BITCOIN Bearish Outlook – June 29, 2025We are the SeoVereign Trading Team.
With sharp insight and precise analysis, we regularly share trading ideas on Bitcoin and other major assets—always guided by structure, sentiment, and momentum.
🔔 Follow us to never miss a market update.
🚀 Boosts provide strong motivation and drive to the SeoVereign team.
--------------------------------------------------------------------------------------------------------
Hello,
This is Seobeorin, approaching technical analysis not as a result but as a prediction, from a realistic perspective.
I am presenting a bearish view on Bitcoin as of June 29, 2025.
If you refer to the Ethereum idea from June 27, 2025, you can confirm that I presented a bearish perspective on Ethereum at the time. The basis for that perspective is still valid, and we are currently waiting for the take-profit level to be reached. The reason I selected Ethereum at the time was because I believed that the downward pressure on Ethereum was relatively stronger than that on Bitcoin.
However, based on today’s Elliott Wave count on the Bitcoin chart, I now judge that Bitcoin is also likely to experience some short-term downward pressure. Therefore, I am presenting a short position idea on Bitcoin.
The first take-profit target is set near $106,056. Depending on future price movements, this take-profit target may be narrowed or expanded. I will continue to track this idea, and as it develops, I will align the reasoning accordingly to organize the thought process more clearly.
Thank you.
Bitcoin Bybit chart analysis July 3Hello
This is Bitcoin Guide.
If you "follow"
You can receive real-time movement paths and comment notifications on major sections.
If my analysis was helpful,
Please click the booster button at the bottom.
Here is the Bitcoin 30-minute chart.
There will be a Nasdaq index announcement at 9:30 and 11:00 in a little while.
I created today's strategy based on the Nasdaq pattern and Tether dominance vertical decline conditions.
*One-way long position strategy when the red finger moves
1. $109,838 long position entry point / stop loss price when the purple support line is broken
2. $111,549.7 long position 1st target -> Great 2nd target
The 1st section at the top and the 2nd section at the bottom are sideways sections.
Even if the strategy fails, if the green support line is not broken,
it is good for a long position.
Below that
Bottom -> Please note that it is open up to 107,841.4 dollars
Up to this point, I ask that you simply use my analysis for reference and use only
I hope that you operate safely with principle trading and stop loss prices.
Thank you.
Intraday Long Setup | July 1st 2025 | Valid Until Daily ClosePrice retraced to a strong pivot zone.
Structure remains bullish with potential for continuation after pullback.
Tight risk control.
Watch for price reaction within the red zone. Entry only if confirmation appears
The setup expires at end of the daily candle close.
Trade Strategy for TodayA popular scalp-retracement strategy could work well given the current consolidation:
1. Short-Term Bearish (Scalp/Short)
Entry range: ~$0.2700–$0.2730 (watch for resistance at $0.2776–$0.2800) .
Targets:
TP1: $0.2650
TP2: $0.2600 (fills the fair value gap)
Stop-Loss: Above $0.2780 (> recent highs)
R/R: ~1:2 — a tight, intraday-leaning trade .
2. Mid-Term Bullish (Rebound/Long)
Wait for a dip into the demand zone (~ $0.2560–$0.2600), then look for bullish confirmation (e.g., hammer candle, volume spike) .
TP1: $0.2775 (previous high)
TP2: $0.2900 (liquidity sweep zone)
Stop: Below $0.2490 (below demand zone)
R/R: ~1:3 — ideal for swing entries .
Bitcoin is currently exhibiting a strong bullish structure on thBitcoin is currently exhibiting a strong bullish structure on the 15-minute timeframe. The price action has consistently formed a series of Higher Lows (HLs), indicating sustained buying pressure and strength in the uptrend.
The most recent HL has been respected, and price is now attempting to bounce from this zone. A long position appears to be in play with a favorable risk-reward setup, suggesting expectations of further upside.
🔼 Key Bullish Signals:
Series of Higher Lows indicate trend continuation.
Price reacting positively near recent HL.
Strong support just below current levels.
📍Resistance (Target): 110,697
📍Support (Stop Loss): 108,534
Bearish Outlook on SOLUSD – Breakdown Below Key SupportSolana (SOLUSD) is showing a clear bearish structure on the 15-minute chart. The price has decisively broken below a crucial horizontal support zone near $149.50, which previously acted as a strong demand area.
This breakdown is accompanied by consistent lower highs and lower lows, confirming bearish momentum. The price has now entered a potential supply zone retest (marked in red), which may act as a resistance if the pullback fails to regain the broken support.
If selling pressure continues and SOLUSD sustains below the $149–$150 zone, we can expect further downside toward the next support levels around $147.50 and $145.00.
🔻 Bearish Confirmation:
Breakdown of key support
Failure to hold above the demand zone
Trend continuation to the downside
📉 Levels to Watch:
Resistance: $149.50 – $150.00 (retest zone)
Support: $147.50 and $145.00 (next bearish targets)