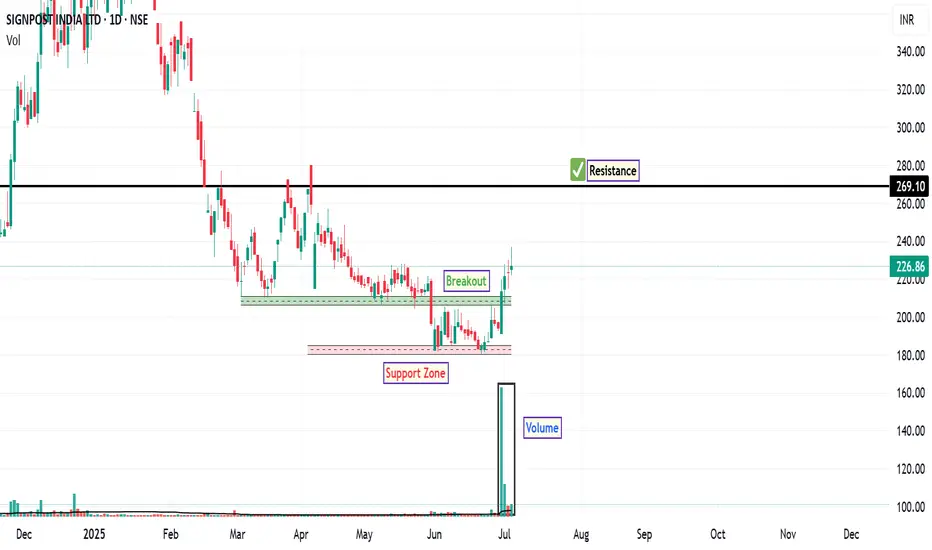
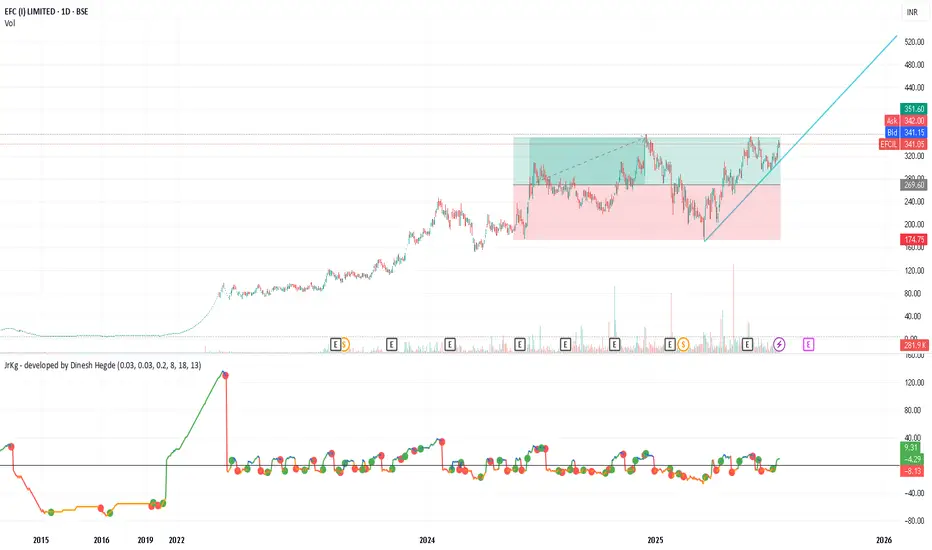
SIGNPOST: Potential Trend ReversalFollowing a significant corrective phase initiated in January 2025, SIGNPOST is now exhibiting a confluence of technical signals that suggest a potential reversal in trend. A noteworthy catalyst appears to be the recent institutional activity, substantiated by a bullish shift in price action, key moving average reclamations, and strengthening momentum indicators.
The most compelling recent development has been the report of bulk deals on Monday and Tuesday of this week. Such large-volume transactions often indicate institutional interest and can act as a catalyst for a shift in market sentiment. This event appears to have marked a local price floor, leading to a sharp upward thrust and suggesting a potential absorption of selling pressure. This influx of significant volume provides a strong foundation for the bullish hypothesis.
The price has now achieved consecutive closes above both its 20-day and 50-day EMAs. These moving averages are critical medium-term trend indicators. By moving above these levels, which previously acted as dynamic resistance during the downtrend, the price action indicates a material change in character. These EMAs may now be observed to act as the first line of dynamic support during any potential pullbacks or periods of consolidation.
Momentum oscillators are also corroborating the bullish price action, indicating a potential underlying shift in market control. The RSI has advanced sharply to a reading of 67. It is important to note that this level indicates strong bullish momentum and is approaching overbought territory, not oversold. A sustained reading above 60 typically signifies a robust and healthy trend is in place.
The MACD has registered a bullish crossover, with the MACD line moving above the Signal line. This is further supported by a positive and expanding histogram, which visually confirms that bullish momentum is accelerating.
The technical developments suggest the current price level is of significant interest. The recent price action indicates a potential shift in sentiment, making the present zone a noteworthy point for observation. The ₹269 price level appears to be the next significant technical hurdle. This area may correspond with prior price structure and could act as a potential zone for profit-taking or consolidation. The ₹181 level serves as a key area of underlying support. A decisive break below this level would potentially undermine the current bullish structure and suggest that the reversal attempt has failed.
Disclaimer: The information provided in this stock analysis is for informational and educational purposes only and should not be construed as financial advice. Always seek the advice of a qualified financial advisor or do own research before making any investment decisions.
Trend Analysis
PRESTIGE – Bullish Continuation with Aggressive Call Build-Up________________________________________________________________________________📈 PRESTIGE – Bullish Continuation with Aggressive Call Build-Up
📅 Setup Date: 18.07.2025 | ⏱ Timeframe: Daily
📍 Strategy: Options Trade Setup
________________________________________________________________________________
Overall Bias: Bullish
Spot Price: ₹1,783.2
Trend: Uptrend resumption with aggressive Call OI build-up
Volatility: IV slightly falling in puts, rising in calls → good for defined risk bullish setups
Ideal Strategy Mix: Bullish with defined reward → Bull Call Spread or Naked CE
________________________________________________________________________________
1. 🔼 Bullish Trade (Naked options as per trend)
Best CE: Buy 1800 CE @ ₹49.10
Why:
• Strong Long Build Up with OI up 225%
• Massive volume (1.78L contracts) and ₹33.2 Cr TTV → clear interest
• Decent delta (approx. 0.5–0.55) → good sensitivity to price movement
• Strike closest to spot + high liquidity = ideal for directional trade
________________________________________________________________________________
2. 🔽 Bearish Trade (Naked options as per trend)
Best PE: Sell 1740 PE @ ₹28.6
Why:
• Price down 46% with high volume (4.2L) = put writing
• OI dropped 6.94% → likely unwinding from short bias
• Deep OTM with stable delta (-0.25 approx)
• Favorable if bullish view sustains and price stays above ₹1,740
________________________________________________________________________________
3. ⚙️ Strategy Trade (As per trend + OI data)
Strategy: Call Debit Spread → Buy 1780 CE + Sell 1820 CE
Net Debit: ₹57.3 - ₹41.1 = ₹16.2
Max Profit: ₹40 (spread) - ₹16.2 = ₹23.8
Max Loss: ₹16.2
Risk:Reward ≈ 1 : 1.47
Lot Size: 450
Total Risk: ₹7,290
Max Profit: ₹10,710
Why:
• 1780 CE shows explosive Long Build Up (OI ↑1031%) → active strike for bulls
• 1820 CE also shows strong Long Build Up (OI ↑1000%) → defined bullish target
• Much better R:R than 1800–1840 while staying aligned with trend
• Defined risk with improved capital efficiency and lower theta burn
________________________________________________________________________________
📘 My Trading Setup Rules
Avoid Gap Plays
→ Check pre-open price action to avoid trades influenced by gap-ups/gap-downs.
Breakout Entry Only
→ Enter trades only if price breaks previous day’s High (for bullish trades) or Low (for bearish trades).
Watch Volume for Confirmation
→ Monitor volume closely. No volume = No trade.
Enter on Strong Candle + Volume
→ Execute the trade only if a strong candle appears with increasing volume in the direction of the trade.
Defined Risk:Reward Only
→ Take trades only if R:R is favorable (ideally ≥ 1:2).(Safe R:R – 1:1)
Premium Disclaimer
→ Option premiums shown are based on EOD prices — real-time premiums may vary during execution.
Time Frame Preference
→ Trade with your preferred time frame — this strategy works across intraday or positional setups.
________________________________________________________________________________
⚠ Disclaimer (Please Read):
• These Trades are shared for educational purposes only and is not investment advice.
• I am not a SEBI-registered advisor.
• The information provided here is based on personal market observation.
• No buy/sell recommendations are being made.
• Please do your own research or consult a registered financial advisor before making any trading decisions.
• Trading involves risk. Always use proper risk management.
I am not responsible for trading decisions based on this post.
________________________________________________________________________________
💬 Found this helpful?
Drop your thoughts or questions in the comments below ⬇️
🔁 Share this post with your trading community – let them benefit from clean charts, structured setups, and zone-based learning.
✅ Follow simpletradewithpatience for charts, clean setups, and educational content based on price action, zones, and risk-managed trades.
🚀 Trade with patience, trust your charts, and stay clear-headed!
Be Self-Reliant | Trade with Patience | Learn with Charts & Zones 📊________________________________________________________________________________
VIPIND: Unlocking Potential After Downtrend
VIP Industries has demonstrated robust bullish momentum over the past few trading sessions, signaling a notable shift in market sentiment. This upward trajectory is particularly significant given the stock's prolonged downtrend since October 2024.
From an Elliott Wave perspective, the recent price action suggests the potential completion of a corrective phase. The retracement from what appears to be Wave 1 to Wave 2 aligns closely with the 61.8% Fibonacci retracement level, which often precedes the initiation of a strong Wave 3 impulse. This potential wave structure, if confirmed, could indicate further upside potential.
A key development supporting this bullish outlook is the stock's recent decisive close above its 200-day EMA, accompanied by a significant surge in trading volume. This confluence of price action and volume confirms strong buying interest and suggests a potential long-term trend reversal. The increased volume further validates the strength of the breakout, indicating broader market participation.
While the immediate outlook appears constructive, traders should be mindful of potential profit-taking around the ₹446 level. This area may present a temporary resistance zone where some short-term corrections or consolidation could occur. However, should the stock successfully navigate this level, the next significant upside resistance target to monitor is ₹492 . This level aligns with prior price highs and could represent a more substantial challenge for further upward movement.
For risk management purposes, a prudent approach would involve considering a stop-loss order positioned below the identified support zone, as depicted on the chart. This strategy aims to mitigate potential downside risk in the event of an unexpected reversal in market sentiment.
Disclaimer: The information provided in this technical analysis is for informational and educational purposes only and should not be construed as financial advice. It is based on observations from the provided chart and commonly used technical indicators. Market conditions can change rapidly, and past performance is not indicative of future results. Always conduct your own comprehensive due diligence and consult with a qualified financial advisor before making any investment decisions.
Multi-Year Support Respected – Is the Bottom In for Rssoftware?🔎 #OnRadar
#Rssoftware (R.S. Software India Ltd.)
Multi-Year Support Respected – Is the Bottom In for Rssoftware?
CMP: 88.10
📊 Technical Outlook (Monthly Chart):
The stock corrected sharply from its #DoubleTop zone of 367, hitting a low near 46—right at a key confluence support zone of 47–52. This zone has historically acted as a strong support and resistance area, and once again, price has shown a bounce from this level.
Currently showing upward momentum, the next significant resistance is around 209. Sustained move above this could potentially lead towards retesting the previous #DoubleTop zone of 357–415 over the long term.
📌 Disclaimer: This is a technical observation shared for educational purposes only. It is not a buy/sell recommendation. Please consult a SEBI-registered advisor before making any investment decisions.
#TechnicalAnalysis | #PriceAction | #ChartSetup | #LongTerm
HDFCAMC – Strong Bullish Breakout on High Volume📈 HDFCAMC – Strong Bullish Breakout on High Volume
📅 Setup Date: 18.07.2025 | ⏱ Timeframe: Daily
📍 Strategy: Short-Term HNI Swing Setup
__________________________________________________________________________________
📝 Price Action Summary – HDFCAMC
HDFCAMC has delivered a textbook price action breakout, marked by a wide-range bullish candle on 3x average volume — confirming strong institutional participation. After weeks of tight consolidation and multiple failed attempts near the ₹5,385 resistance zone, the price finally broke out with a clean close near day’s high, indicating minimal selling pressure and clear buyer dominance. The breakout follows a classic compression-before-expansion setup, with the previous range acting as a base for momentum. Importantly, the absence of upper wick, strong follow-through, and volume-backed surge signal genuine strength — not a false breakout. Price has now entered a discovery phase with open space toward ₹5,673–₹5,800. As long as ₹5,385 holds as support, the bulls remain in control, and dip buying remains a high-probability setup. This is a classic case of price action speaking louder than indicators — structure, strength, and story all aligned.
__________________________________________________________________________________Trade Logic – Why This Setup:
Strong Price Structure: The stock has formed a bullish candle backed by a 20-day volume breakout, closing near the highs—indicating strong, sustained demand.
Breakout Confirmation: Price has cleanly broken out from a short-term base formed by multiple candle congestion. It's also trading above the prior resistance level of ₹5,385, confirming breakout strength.
__________________________________________________________________________________ Indicator Confluence: The RSI stands strong at 72, signaling bullish momentum. Additionally, the stock is breaking out of a Bollinger Band squeeze—an early sign of a potential momentum ignition. MACD, CCI, and Stochastic indicators are all aligned in bullish zones across daily, weekly, and monthly timeframes.
EMA Alignment: The stock is trading above all major exponential moving averages (9, 20, 50, 100, and 200 EMA), suggesting healthy trend harmony and support at every timeframe.
VWAP Positioning: Current price action remains well above the daily VWAP, indicating buying interest from institutional players and strong demand zones building underneath.
Volume Spike: Today's volume was 1.61 million, compared to the 10-day average of 452,000—more than a 3x surge, confirming strong buyer conviction and institutional participation.
Open Upside Potential: There are no significant supply zones visible until ₹5,800–₹6,000, offering a clear path for price expansion and swing targets.
Sector Tailwinds: The financial services and AMC sector is witnessing renewed traction after positive earnings and improved fund flow trends, supporting broader strength in related counters.
__________________________________________________________________________________ Would I Enter Now?
YES – Enter Now or on Dip
Reason: Price has just cleared a major volume cluster with strong momentum. Waiting too long might mean missing the breakout. The best approach would be:
• Enter 50% now
• Add 50% near ₹5,495–₹5,485 if there’s an intraday dip
__________________________________________________________________________________ 📈 Resistance Zones
• 🔴 R1: 5,591.5 (possibly weak)
• 🔴 R2: 5,673
• 🔴 R3: 5,797
📉 Support Zones
• 🟢 S1: 5,385
• 🟢 S2: 5,261
• 🟢 S3: 5,179
__________________________________________________________________________________ Direction: Buy (Bullish Bias)
Entry Price: ₹5,510 (Current Market Price)
Alternate Entry: On slight dips to ₹5,485–₹5,495 (ideal risk-managed zone)
Stop Loss: ₹5,385
Reason: This is Support 1 and a key VWAP-based level from the recent volume structure. A breach here invalidates the bullish strength.
Risk–Reward Ratio: 1:1 | 1:2 | +
__________________________________________________________________________________ Overall Bias: Bullish
Spot Price: ₹5,510
Trend: Strong upward momentum
Volatility: Slightly cooling IV (esp. in puts), but still elevated → good for defined-risk strategies
Ideal Strategy Mix: Naked CE or Call Debit Spread (defined-risk bullish strategy)
1. 🔼 Bullish Trade (Naked options as per trend)
Best CE: Buy 5400 CE @ ₹197.95
Why: Strong long buildup with rising OI, high volume, and solid delta — indicating institutional interest and momentum-backed directional strength.
__________________________________________________________________________________ 2. 🔽 Bearish Trade (Naked options as per trend)
Best PE: Sell 5200 PE @ ₹26.5
Why: Strong put writing seen with rising OI and price drop, suggesting low downside risk and income potential if bullish trend holds.
__________________________________________________________________________________
3. ⚙️ Strategy Trade (As per trend + OI data)
Strategy: Call Debit Spread → Buy 5400 CE + Sell 5600 CE
Net Debit: ₹197.95 - ₹92.6 = ₹105.35
Max Profit: ₹200 (spread) - ₹105.35 = ₹94.65
Max Loss: ₹105.35
Risk:Reward ≈ 1 : 0.9
Lot Size: 150
Total Risk: ₹15,802.5
Max Profit: ₹14,197.5
Why: This call spread is ideal because both the 5400 CE and 5600 CE are showing strong long build-up, indicating that traders expect the price to move higher. The 5600 CE has a sharp 168% jump in open interest with high volume, suggesting it’s a realistic target zone. By using a spread (buying 5400 CE and selling 5600 CE), we reduce the upfront cost and limit losses while still capturing upside. It also protects against time decay if the stock consolidates before moving up.
__________________________________________________________________________________ ⚠ Disclaimer (Please Read):
• These Trades are shared for educational purposes only and is not investment advice.
• I am not a SEBI-registered advisor.
• The information provided here is based on personal market observation.
• No buy/sell recommendations are being made.
• Please do your own research or consult a registered financial advisor before making any trading decisions.
• Trading involves risk. Always use proper risk management.
STWP is not responsible for trading decisions based on this post.
__________________________________________________________________________________ 💬 Found this helpful?
Drop your thoughts or questions in the comments below ⬇️
🔁 Share this post with your trading community – let them benefit from clean charts, structured setups, and zone-based learning.
✅ Follow simpletradewithpatience for charts, clean setups, and educational content based on price action, zones, and risk-managed trades.
🚀 Trade with patience, trust your charts, and stay clear-headed!
Be Self-Reliant | Trade with Patience | Learn with Charts & Zones 📊
__________________________________________________________________________________
*********************************************************************************************************************
Caution: This is a result based stock
*********************************************************************************************************************
Radhika Jeweltech – Classic Contraction PatternTimeframe: Weekly
Structure Observed: Contraction Pattern between Trendlines
Volume: Significant recent uptick 📊
Key Zones:
🔴 Supply Zone above 123
🟢 Dynamic Support from ascending trendline
🟠 Active counter-trendline now breached
After months of lower highs and higher lows, the price has been squeezing into a classic contraction pattern between a descending orange trendline (acting as counter-trendline resistance) and a rising green trendline providing consistent support.
This week’s candle has decisively broken above the descending trendline on strong relative volume.
With the weekly close due tomorrow, all eyes remain on how the candle settles — will it sustain this breakout structurally or retreat below the trendline?
📌 Important Note: This is a technical observation — not a trade recommendation.
EFCI Stock Analysis: Hidden Gem with Multibagger Potential🚀 EFC (I) Ltd: On Track to Hit ₹560 — Multibagger in the Making
1. Sector Leadership & Contract Wins
EFC recently clinched a ₹183 cr interior turnkey fit‑out project with a major Indian MNC
Bloomberg.com
+11
Screener
+11
The Economic Times
+11
, showcasing its strength in a niche where it consistently outperforms competitors.
2. Financial Momentum & Operational Excellence
Market cap stands at ~₹3,395 cr, with a current stock price around ₹341
ICICI Direct
+6
Screener
+6
INDmoney
+6
.
Q4 FY25 results revealed revenue of ₹211 cr (+19% YoY) and net profit of ₹48 cr (+19%) .
Efficiency gains evident—debtor days fell from ~71 to ~55, and working capital cycle improved from 142 to 105 days
Screener
.
Return ratios are healthy: ROCE ~21%, ROE ~23%
The Economic Times
+2
Screener
+2
INDmoney
+2
.
3. Analyst Outlook and Valuation Potential
Although consensus 12‑month target is ₹465 (~36% upside)
Screener
+12
Investing.com
+12
INDmoney
+12
, the company’s robust growth trajectory and order pipeline support a far more ambitious outcome.
4. Technical Confirmation (Your Chart Setup)
Your proprietary chart signals align perfectly: strong momentum and breakout structure suggest a swift move to ₹560. This isn’t theoretical—it’s anchored in recent price action and validated patterns.
📈 To Summarize:
High-Quality Business: Clear leadership in the real estate services niche and strong recent order flow.
Growth & Efficiency: Double-digit YoY revenue/profit growth, with improving working capital conversion.
Valuation Re-rating in Sight: Justified by fundamentals and technical momentum.
Bullish Target: From the current ₹340–345 region, we see a realistic path to ₹560 based on converging drivers.
At Critical Resistance!testing a strong resistance zone near ₹3,220
A level that has rejected price multiple times in the past 10 months.
🟢 If it breaks out, we could see a fresh bullish rally toward new all-time highs.
🔴 If rejected, expect sideways or bearish pressure back to the ₹3,000–₹3,100 zone.
This is a make-or-break level
Smart money is watching.
Gold data stimulates flash crash, shorts break 3300?Gold data stimulates flash crash, shorts break 3300?
Market review: Risk aversion changes instantly, gold price rises and falls
Yesterday, the gold market experienced dramatic fluctuations again. First, it fell to around 3320 due to the pressure of the strengthening of the US dollar, and then it soared by 50 US dollars to 3377 in the short term due to the rumor that "Trump may fire Powell", but the gains were given back after the news was clarified, and finally closed at around 3347. The daily line closed positive but failed to break through the key resistance.
In the early Asian session today, the gold price fluctuated narrowly around 3346, and the market traded cautiously. The US retail sales and initial jobless claims data were strong, the US dollar index rose in the short term, the US Treasury yield rose, and gold fell under pressure to below 3320. However, the market still has differences on the Fed's policy, and the downward space of gold prices may be limited.
Technical analysis: The shock has not been broken, and high selling and low buying are still the main theme
1. Daily level: The range shock continues
Key range: 3320-3375, three times of probing 3375 but not breaking, two times of testing 3320 to get support, showing that the long and short tug-of-war is fierce.
Indicator signal: KDJ is blunted, MACD is glued, MA5-MA10 is golden cross but the momentum is insufficient, and it is difficult to form a unilateral trend in the short term.
2. 4-hour level: Short-term correction pressure increases
MACD dead cross, KDJ turns downward, indicating that there is still a short-term correction demand, and the support below focuses on 3320 (the lower track of the Bollinger band). If it falls below, it may test 3300-3285.
The upper resistance is 3358-3377. If it breaks through, it may test the 3400 mark, but be wary of the risk of high-rise decline.
Operation strategy: Buy low, don’t chase short
Short-term low-long: Try to buy with a light position when it falls back to 3310-3315, stop loss 3300, target 3340-3350.
High-altitude opportunity: If it rebounds to 3365-3370 and is under pressure, you can try short-selling, stop loss 3380, target 3350-3340.
Follow-up after breakout: If it unexpectedly falls below 3300, wait and see and wait for the support of 3280-3260 before considering buying low; if it breaks through 3400, it may open up upside space, but be wary of false breakthroughs.
Market sentiment and risk warning
Negative factors: The dollar is stronger, the US Treasury yields are rising, and the Fed’s expectations of rate cuts are cooling down.
Positive support: Geopolitical uncertainty, the risk of high valuations of US stocks, and the market’s sensitivity to economic data is still high.
Personal opinion: Although the data is bearish for gold in the short term, the market is still in a volatile pattern and it is not advisable to chase the short position. Conservative investors should wait for key support levels to buy low, or follow the trend after a breakthrough.
Gold’s Next Move After False Headlines & Liquidity sweepXAUUSD 17/07 – MMF Insights: Gold’s Next Move After False Headlines & Liquidity Sweep
🧭 Market Sentiment: Macro Distractions Fuel Uncertainty
The gold market remains under pressure as conflicting geopolitical news and central bank rumors stir volatility. The week opened with rumors that Donald Trump might fire Fed Chair Jerome Powell, sending temporary fear across markets. While Trump later denied the claim, the damage was already done – sentiment remains fragile.
Other active drivers:
Israel’s airstrikes in Syria increase global tension.
EU proposes tariffs on US imports, adding trade friction.
BlackRock warns of delayed inflation pressure as tariffs begin impacting electronics & consumer goods.
💡 All these elements support gold’s potential role as a hedge, but technical signals suggest the market remains undecided.
🔍 MMF Technical Flow Outlook
According to MMF analysis, price structure is unfolding in line with expected liquidity sweeps and order block reactions:
Price rejected from key supply zones near 3,342 – 3,344 (OB + CP structure).
Current bounce around 3,330 – 3,320 signals possible accumulation.
If buyers hold above 3,310, we may see price test the upper OB/VPOC zones again.
Break below 3,310 opens the door toward the MMF liquidity trap zone at 3,296 – 3,294.
🎯 Trade Plan – Precision Entries
🟩 Buy Zone
Entry: 3,312 – 3,310
Stop Loss: 3,306
Take Profits:
→ 3,316 → 3,320 → 3,324 → 3,328 → 3,335 → 3,340 → 3,350
✅ This zone aligns with MMF liquidity retention and H1 continuation structure. Watch for bullish confirmation candles before entry.
🟥 Sell Zone
Entry: 3,362 – 3,364
Stop Loss: 3,368
Take Profits:
→ 3,358 → 3,354 → 3,350 → 3,345 → 3,340
⚠️ Ideal for short-term scalping or reversal confirmation setups. Rejection at VPOC or CP structure validates this zone.
⚠️ Key Notes for Indian Traders
Today’s sentiment is fragile and can shift fast with any unexpected statement from US Fed or geopolitical update.
Apply MMF structure in lower timeframes (M15/H1) for cleaner confirmation.
Avoid early entries. Wait for reaction signals near the marked zones.
💬 What Do You See Ahead?
Will MMF signals lead the market toward the deep FVG zone around 3,296?
Or are bulls getting ready to reclaim 3,360+ zones?
👇 Share your view and let’s trade smarter together with MMF precision.
GOLD Breakdown at the Barrier: Bears Regain Grip Below ₹78,800GOLD has once again faced a strong rejection at the ₹78,800 resistance, triggering a sharp decline to ₹77,899 and breaking the recent higher low structure. Despite multiple attempts, the price failed to close above this key supply zone, signalling active seller presence. The short-term trend has turned neutral-to-bearish, with immediate support at ₹77,500 and deeper downside potential toward ₹76,700 if this level fails. Resistance remains firm at ₹78,800, ₹79,500, and ₹80,000. Unless bulls reclaim ₹78,800, sellers are likely to dominate, reinforcing a cautious to bearish outlook.
OK.....
No problem ,
Lets Wait
How Bears ACT
But ULTIMATELY BULLS WIN !!!
"Big Move Loading on EUR/USD! 🔥 "Big Move Loading on EUR/USD! 🚨"perfect Elliott Wave trap is forming – will you catch the fall or get caught at the top? 📉📈
Future Projection (Right Side Drawing)
You have projected a Bearish 5-Wave Impulse (Elliott Wave):
1. The market is expected to reverse from the C wave top (around 1.16023 - 1.16294).
2. After this, a 5-wave bearish pattern may unfold.
3. Target: Down to the 1.16017 → 1.15449 zone.
---
📌 Key Levels to Watch:
Level Significance
1.16294 Strong resistance (Wave C potential top)
1.16023 Minor resistance
1.16022 Price is near this resistance zone
1.16017 Break of this confirms bearish impulse
1.15937 Minor support
1.15449 Major support / Final target
---
🧠 Trading Insight:
If you're trading this:
✅ Sell Setup Activation: Wait for rejection in the C zone (1.16022–1.16294).
📉 Short Entry: After confirmation (bearish engulfing, trendline break, etc.).
🎯 Targets: 1.16017 → 1.15937 → final target 1.15449.
🛑 Stop Loss: Above 1.16300 ideally
Falling Wedge Pattern
ABC Zigzag Correction
Elliott Wave (5-wave bearish projection)
Supply & Demand Zones
Price Action Confirmation
---
Tech Mahindra Consolidates in a Wedge After Strong Support at KeTopic Statement:
TechM has been stuck in a consolidation zone, rebounding from strong support levels and forming a wedge pattern that may signal an upcoming breakout.
Key Points:
* The stock corrected up to the 30% Fibonacci retracement level, finding strong support around 1314
* It touched the 200-day moving average, which acted as a support and triggered a rebound
* The candlestick formation resembles a wedge, clearly marked on the chart with blue trend lines, indicating potential for a decisive move ahead
Long Setup from Demand Zone | Target 25,412 | SL: 24,959The Nifty 50 Index is currently trading near a strong demand zone around 24,959, which has held previously and acted as solid support. Price action indicates potential for a reversal from this zone, making it an attractive long setup.
Price formed a potential double bottom/accumulation structure at the highlighted demand zone.
We saw buying interest emerge previously from this level, suggesting institutional demand.
The price has not yet closed below the 24,959 support, keeping the bullish bias valid.
Entry: Near current level (around 25,100)
Target: 25,412 (prior resistance zone and structure breakdown area)
Stop Loss: Closing below 24,959 (strong invalidation point)
R:R - Favorable, with limited downside and potential upside toward previous swing high.
This setup is based on price action and key horizontal support-resistance levels. A breakout above minor resistance could confirm bullish continuation.
BTCUSD Forming Bullish W Pattern – Targeting 121083In this 15-minute chart of BTCUSD, we can observe a potential bullish reversal pattern forming—commonly referred to as a "W" or double bottom. The price recently retraced from the 119000 zone and found support around 117000, completing the second leg of the pattern.
The structure indicates strong buying interest at lower levels and a possible continuation to the upside. If the pattern completes, we can expect the price to break above the neckline resistance at 119500 and target the next key resistance level at 121083.19, marked by the yellow horizontal line.
Trade Plan:
Entry: Around 117500–118000 (after confirmation of support)
Target: 121083
Stop Loss: Below recent swing low ~116500
Risk-to-Reward: Approximately 1:2+
This setup is valid as long as the price holds above the 116500 level. A break below that would invalidate the bullish structure.
FMCG & ConsumptionThink about your daily life — the toothpaste you use, the biscuits you eat, the shampoo you prefer, the tea you drink, the food delivery app you order from. Every one of these touches a part of the FMCG & consumption sector.
Now multiply that by 1.4 billion Indians, and you realize the size of this engine.
In 2025, the FMCG (Fast-Moving Consumer Goods) and consumption-driven stocks are at the center of a powerful story — one shaped by:
India's rising middle class
Rural income revival
Urban premiumization
Growth of e-commerce and quick commerce
Digital payments & new-age D2C (Direct-to-Consumer) brands
This isn't just a theme — it's a structural growth trend that never goes out of fashion.
Let’s break it down step-by-step.
🧼 What is FMCG & Consumption Sector?
FMCG stands for Fast-Moving Consumer Goods. These are everyday products people buy frequently:
Food & beverages (biscuits, noodles, soft drinks, snacks)
Personal care (soap, shampoo, deodorant)
Household items (detergent, floor cleaner, toothpaste)
Over-the-counter (OTC) products (balms, cough syrup, nutrition)
The Consumption theme expands on this to include:
Retail (organized & unorganized)
Quick commerce (Blinkit, Zepto)
E-commerce (Amazon, Flipkart, Nykaa)
Food delivery (Zomato, Swiggy)
Apparel & footwear (Trent, Aditya Birla Fashion)
Durables & electronics (TVs, fridges, fans, phones)
So whether it’s Maggi or Myntra, Parle-G or Paytm Mall — it all fits under Consumption.
🔥 Why FMCG & Consumption Is Trending in 2025
Let’s look at what’s driving this sector today:
1️⃣ Rural Demand Is Rebounding
After 2 years of low rural growth due to inflation and erratic monsoons, 2025 has brought strong crop output, stable agri prices, and more cash in hand.
Rural India forms over 40% of FMCG consumption, especially:
Entry-level soaps, snacks, tea
Sachet products
Local brands
Companies like Dabur, HUL, Marico, and Emami have all confirmed rural growth is picking up fast.
2️⃣ Premium Urban Consumption Is Booming
At the same time, India’s cities are upgrading:
Tier-2 cities now demand premium face creams, health foods, organic juices
Young consumers are choosing branded wear, subscription boxes, and gourmet snacks
Working women are driving personal care product sales
Urban India is moving from price to value, and that’s a goldmine for consumer brands.
3️⃣ Quick Commerce Is Changing Habits
Apps like Blinkit, Zepto, Swiggy Instamart are:
Delivering goods in 10–20 minutes
Creating new demand cycles (midnight snacking, impulse buys)
Becoming a new channel for FMCG sales
For FMCG companies, this means higher turnover and visibility, especially for smaller SKUs (sachets, ₹5/₹10 packs).
4️⃣ Direct-to-Consumer (D2C) Boom
New-age startups like:
Mamaearth (beauty, baby care)
WOW Skin Science (natural shampoos)
BoAt (audio & smart accessories)
Licious (fresh meats)
…are bypassing traditional stores and selling directly online.
This model:
Cuts middlemen
Boosts margins
Creates brand intimacy
And now many of these brands are listed or IPO-ready, adding fire to the consumption story.
5️⃣ China+1 & Make in India Push
Many global companies now manufacture in India, not China:
Personal care
Cosmetics
Packaged foods
This reduces costs, improves supply chains, and boosts exports of Indian FMCG brands too.
📈 Stock Market Performance (2023–2025)
Let’s take a look at how some top names have performed:
Stock Jan 2023 Price July 2025 Price Return
ITC ₹340 ₹460+ 35%
Hindustan Unilever ₹2,500 ₹2,800+ 12%
Dabur ₹550 ₹675+ 22%
Nestle India ₹18,000 ₹24,000+ 33%
Zomato ₹55 ₹195+ 250%+
Nykaa ₹120 ₹180+ 50%
Mamaearth (Honasa) ₹320 (IPO) ₹460+ 44%
Quick commerce, D2C and food delivery stocks have been top gainers.
Traditional FMCG majors are more slow & steady compounders.
🛒 Segments Inside FMCG & Consumption
Let’s divide this into sub-themes:
🍪 1. Packaged Foods & Beverages
Britannia (biscuits)
Nestle India (Maggi, chocolates)
Tata Consumer (tea, coffee, salt)
Varun Beverages (Pepsi bottling)
Bikaji, Prataap Snacks (local snacks)
🧼 2. Personal & Household Care
HUL (Dove, Surf Excel, Lifebuoy)
Dabur (Chyawanprash, Vatika)
Marico (Parachute, Saffola)
Godrej Consumer (Goodknight, Cinthol)
Emami (Fair & Handsome, Navratna)
🛍️ 3. Retail Chains & Apparel
Trent (Westside, Zudio)
V-Mart
Avenue Supermarts (D-Mart)
Aditya Birla Fashion (Pantaloons, Van Heusen)
Shoppers Stop
🍕 4. Online Food & Quick Commerce
Zomato
Jubilant Food (Domino’s)
Devyani International (KFC, Pizza Hut)
Zepto (IPO coming soon)
Blinkit (part of Zomato)
💄 5. Beauty & D2C Personal Care
Honasa (Mamaearth)
Nykaa
Lotus Herbals (Private)
WOW Skin Science (IPO Expected)
💡 Why Traders and Investors Love This Sector
✅ Always in Demand – Recession or boom, people still need soap and toothpaste.
✅ Strong Brand Power – Consumer loyalty = pricing power = margin stability.
✅ Low Capex Businesses – High return on capital, especially for asset-light D2C models.
✅ Growth via Premiumization – Indians are trading up from "cheap" to "value".
✅ Earnings Predictability – FMCG companies often beat or meet earnings estimates.
📊 How to Trade or Invest in This Theme
🎯 For Long-Term Investors:
Pick 3–4 companies across segments:
One traditional FMCG major (HUL, ITC)
One high-growth food player (Nestle, Varun Beverages)
One retail/delivery stock (Zomato, Trent)
One new-age D2C story (Mamaearth, Nykaa)
Hold for 3–5 years. These stocks are slow compounders with low risk + decent reward.
📉 For Traders:
Look for volume breakouts after consolidation
Track monthly updates on rural/urban growth
Trade around quarterly results and guidance
Use options strategy around earnings for volatility plays (like Zomato)
⚠️ Risks to Watch Out For
Risk Explanation
Inflation Pressure Higher input costs (milk, palm oil) hurt margins
Valuation Concerns Some D2C stocks may be overpriced
Competition from Local Players Especially in rural and Tier-3 cities
Dependency on Monsoon A weak monsoon can dent rural demand
🚀 The Road Ahead (2025–2030)
India is expected to:
Add 250 million middle-class consumers by 2030
See online retail double in size
Witness over 500 million people shop on mobile phones
Grow FMCG exports to Asia & Africa
The Indian consumption engine is just starting up. This isn't a temporary trend — it’s a secular, multi-decade opportunity.
✅ Conclusion
The FMCG & consumption story in India is:
Stable during slowdowns
Explosive during booms
Universal in reach — touching every home, city, and village
Now evolving rapidly with D2C, quick commerce, and premiumization
Whether you're an investor looking for consistent compounding or a trader looking for smart momentum plays, this is one of the most powerful sectors to focus on in 2025 and beyond
Difference Between Technical Analysis and Option Chain Analysis✅ 1. What is Technical Analysis?
Technical Analysis (TA) is the art and science of predicting future price movements based on historical price and volume data.
It’s like checking a stock’s past behavior on a chart to guess what it might do next.
🧠 How Does It Work?
Uses charts (candlestick, line, bar)
Studies patterns (head and shoulders, cup & handle, flags, etc.)
Applies indicators (RSI, MACD, Moving Averages, Bollinger Bands)
Identifies support & resistance levels
Helps time entry and exit points
📊 What Does It Tell You?
Is the stock trending up or down?
Is it overbought or oversold?
Where are strong support/resistance zones?
Is a breakout or breakdown happening?
🧰 Tools Used in Technical Analysis:
TradingView, Chartink, Zerodha Kite, Upstox Pro, etc.
Indicators: RSI, MACD, EMA, VWAP, Supertrend
Patterns: Breakout, Double Top, Flag Pattern, etc.
✅ 2. What is Option Chain Analysis?
Option Chain Analysis is specific to derivatives trading. It looks at open interest (OI), premiums, and strike prices to understand what option traders are betting on.
It helps you decode the behavior of big players (institutions) in the options market — especially on indices like Nifty, Bank Nifty or liquid stocks like Reliance, HDFC Bank, etc.
🧠 How Does It Work?
An option chain shows all available strike prices and their:
Call (CE) and Put (PE) premiums
Open Interest (OI) — how many contracts are outstanding
Changes in OI — fresh buying/selling activity
Volume traded
Implied Volatility (IV) — market’s expectations of volatility
📊 What Does It Tell You?
Where is the market expecting resistance? (High Call OI = resistance)
Where is the market expecting support? (High Put OI = support)
What are option writers (big players) doing?
Is the market bullish, bearish, or neutral?
🧰 Tools Used in Option Chain Analysis:
NSE Website (Option Chain)
Sensibull, Opstra, QuantsApp, StockMock
Open Interest Analysis Tools
PCR (Put Call Ratio)
Max Pain Theory
⚖️ Key Differences: Technical Analysis vs Option Chain Analysis
Feature Technical Analysis Option Chain Analysis
Used For Any stock, index, or crypto Only in derivatives (Options)
Data Based On Price, volume, chart patterns OI, strike prices, premiums, IV
Who Uses It? All traders (equity, F&O, forex, crypto) Mostly F&O traders and option
Time Horizon Intraday to long-term Intraday to expiry-based
📌 Practical Example (Nifty)
🔍 Technical View:
Nifty is making higher highs, higher lows
RSI = 60 → Momentum is still strong
20 EMA is acting as support
➡️ Suggests bullish trend — buy on dips
📈 Option Chain View:
Highest Call OI at 24,000 → Strong resistance
Highest Put OI at 23,500 → Strong support
Put writing increasing at 23,600 → Bulls defending this level
➡️ Suggests market may stay between 23,500–24,000
🎯 When to Use Which?
Situation Use This
Want to analyze a stock's trend Technical Analysis
Trading non-derivativ e stocks Technical Analysis
Intraday scalping Both (TA + OI levels)
Trading Nifty/Bank Nifty Options Option Chain Analysis
Looking for expiry range predictions Option Chain
Want to confirm breakout strength Combine both!
💡 Best Strategy: Combine Both!
Professional traders don’t treat these as either-or.
They often use:
📉 Technical analysis to find chart setups
🧠 Option chain data to confirm big player positions
Example:
A breakout on chart + strong Put OI at breakout level = high-probability trade.
✅ Summary
Aspect Technical Analysis Option Chain Analysis
Based on Charts, price, volume OI, premiums, strike data
Used for All trading instruments Only options
Helps in Timing trades, spotting patterns Predicting expiry range
Tools RSI, MACD, Patterns, EMAs OI, IV, Max Pain, PCR
Users Retail + institutional traders Mainly option traders, F&O players
🚀 Final Thought
Both tools are powerful in their own right. But when used together, they give you a 360° edge in the markets.
Technical analysis shows you what's happening on the chart.
Option chain analysis shows you what traders expect to happen behind the scenes.
Mastering both is the true trader’s advantage