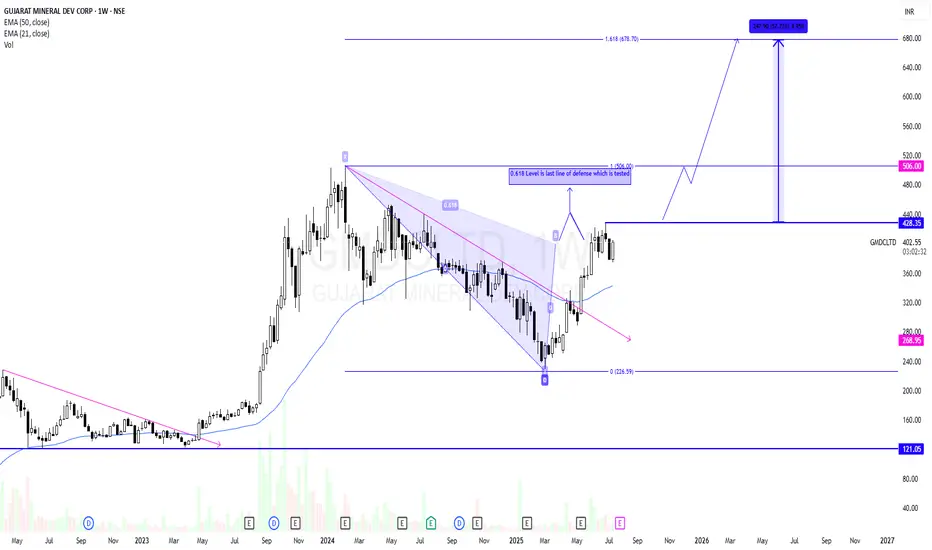
GMDCLTD - Potential Swing CandidateGMDCLTD has recently ended its correction phase and reversed. It has retraced till 0.618 level and has got a small rejection. 0.618 is last line of defence for sellers in many cases. Above 0.618 level a strong momentum likely to come.
Risk will be previous swing low after breakout.
As per price structure 430 is the last swing high. Breakout will start a strong momentum towards ATH and above that it is likely to test 678 as per Fib extension.
So put an alert to track this for your learning.
Learning Part :-
A rise in price then a correction in a channel formation is good to buy on breakout.
I am Not SEBI Registered
This is my personal analysis for my personal trading. Kindly consult your financial advisor before taking any actions based on this.
Trend Analysis
Bank Nifty Trade Setup for July 19, 2025 |Bank Nifty is currently trading around 56,250, in a tight range between a strong 4H demand zone and multiple overhead supply zones. After a sharp fall from ~57,400, price has stabilized near the 56,140–56,200 demand base. A bounce or breakdown from this zone will decide the next intraday trend.
🔴 Key Supply Zones (Resistance):
56,420 – 56,500 → Fresh 15-min bearish zone (recent rejection)
56,700 – 56,820 → Previous base before breakdown (1H/4H supply)
57,180 – 57,400 → Major resistance from 4H chart (sharp sell-off zone)
🟢 Key Demand Zone (Support):
56,140 – 56,200 → Strong buying base seen across 15min to 4H. Market is holding here with multiple rejections.
📈 Trading Scenarios:
1. Long Trade Plan (Buy on Rejection from Demand Zone):
Entry: Above 56,230 (after bullish reversal confirmation)
Stop Loss: Below 56,120
Target 1: 56,420
Target 2: 56,700
2. Short Trade Plan (Sell on Rejection from Supply Zone):
Entry: Below 56,390 if price rejects 56,420–56,500 zone
Stop Loss: Above 56,520
Target: 56,200
3. Breakdown Trade (Aggressive Bearish Bias):
Break below 56,140 with retest failure
Entry: On retest rejection of 56,140–56,160
Target: 55,900 – 55,600
Stop Loss: Above breakdown retest high
🧭 Bias:
Neutral to Bullish as long as price respects 56,140.
Breakdown below 56,140 would shift bias to Bearish.
⚠️ Notes:
Wait for confirmation candles, especially on 15-min chart
Avoid trades in the middle of the range (56,200–56,400) unless structure is clear
Monitor broader market cues (Nifty + global indices) before confirmation
bullish setup spotted on CGCLCapri Global is a diversified Non-Banking Financial Company (NBFC) with a presence across diverse segments like MSME, Affordable Housing, Construction Finance segments, and Car Loan distribution; forayed into Gold Loans in Aug 22
Company is expected to give good quarter
Company has delivered good profit growth of 24.3% CAGR over last 5 years
Company's median sales growth is 31.5% of last 10 years
Nifty Intraday Analysis for 18th July 2025NSE:NIFTY
Index has resistance near 25250 – 25300 range and if index crosses and sustains above this level then may reach near 25450 – 25500 range.
Nifty has immediate support near 25000 – 24950 range and if this support is broken then index may tank near 24800 – 24750 range.
"Together for Tomorrow"📌 Vodafone Idea Ltd – Chart at Crucial Support Zone
🔍 Stock has successfully respected long-term support near ₹6.10–7.40 multiple times since 2021.
✅ Recent bounce backed by strong volume and improving technical structure.
✅ Gradual accumulation visible since past few weeks.
✅ RSI and price action both attempting to hold higher lows.
✅ OBV and momentum indicators hinting at early signs of recovery.
✅ Price trading inside a broad ascending triangle pattern since 2020 – potential breakout above ₹9 could confirm long-term trend reversal.
🧠 Risk-Reward looks favourable for long-term positional investors from current levels, with strict SL near ₹6.10.
🎯 Ideal for positional traders & long-term investors with a medium-term view.
📝 Note: Please do your own due diligence. This is not a recommendation, just a view based on charts and fundamentals.
🧠 Disclaimer: For educational and research purposes only. No buy/sell advice.
📝 Chart Purpose & Disclaimer:
This chart is shared purely for educational and personal tracking purposes. I use this space to record my views and improve decision-making over time.
Investment Style:
All stocks posted are for long-term investment or minimum positional trades only. No intraday or speculative trades are intended.
⚠️ Disclaimer:
I am not a SEBI registered advisor. These are not buy/sell recommendations. Please consult a qualified financial advisor before taking any investment decision. I do not take responsibility for any profit or loss incurred based on this content.
NIFTY Levels for TodayHere are the today's NIFTY Levels for intraday (in the image below). Based on market movement, these levels can act as support, resistance or both.
Please consider these levels only if there is movement in index and 15m candle sustains at the given levels. The SL (Stop loss) for each BUY trade should be the previous RED candle below the given level. Similarly, the SL (Stop loss) for each SELL trade should be the previous GREEN candle above the given level.
Note: This idea and these levels are only for learning and educational purpose.
Your likes /boosts gives us motivation for continued learning and support.
Bank nifty correction start now?Bank Nifty
Current Price: 56,791.95 (Spot)
Bank Nifty has reversed lower from the resistance trendline, confirming selling pressure near higher levels.
A Dark Cloud Cover candlestick pattern combined with an emerging M-top formation indicates potential short-term bearish sentiment.
It can short here or any bounce use as shorting opportunity for target 56,056
Major resistance is 57,400-57,700
The index is forming a rising wedge pattern, a bearish structure suggesting potential for deeper correction if key support levels are breached.
Key Support Levels:
Immediate support is identified at 56,056 (trendline support).
A decisive close below 56,056 may accelerate selling pressure, opening downside targets toward: 55,342 , 53,908
SWSolar Sterling & Wilson cmp 335.10 by Daily Chart viewSWSolar cmp 335.10 by Daily Chart view
- Support Zone 280 to 305 Price Band
- Resistance Zone 340 to 365 Price Band
- Bullish VCP Pattern completed on stock chart
- Volumes spiking heavily at regular intervals by demand based buying
- Resistance Zone Neckline Breakout maybe seen unfolding in the near future
TATVA: Positive divergenceTATVA stock is showing positive RSI and MACD divergence in daily timeframe.
… which indicates a possible reversal…
Divergence with RSI and MACD in daily timeframe;
The price is making a lower low and
the RSI and MACD are making a higher high
which indicates a possible reversal of trend.
I'm not a registered Sebi analyst. My research is done solely for academic purposes.
Please consult your financial advisor before trading or investing. I bear no responsibility for your profits or losses.
Regards,
Dr Vineet
NIFTY MATHEMATICAL LEVELSThese Levels are based on purely mathematical calculations.
Validity of levels are upto expiry of current week.
How to use these levels :-
* Mark these levels on your chart.
* Safe players Can use 15 min Time Frame
* Risky Traders Can use 5 min. Time Frame
* When Candle give Breakout / Breakdown to any level we have to enter with High/Low of that breaking candle.
* Targets will be another level marked on chart
* Stop Loss will be Low/High of that Breaking Candle.
* Trail your SL with every candle.
* Avoid Big Candles as SL will be high then.
* This is one of the Best Risk Reward Setup.
For Educational purpose only
Gold Surges After Softer PPI – Is a New Rally in the Making?Gold spiked sharply following a cooler-than-expected U.S. PPI for June, signaling easing inflationary pressures at the producer level. This immediately triggered a pullback in the dollar and yields, reigniting flows into precious metals.
On the H2 chart, gold rebounded strongly from the $3,325 support area, filling a Fair Value Gap and climbing past $3,340. Bullish momentum is building, as rising volume around $3,330 reflects growing demand.
Meanwhile, dovish signals from Europe have caused significant EUR volatility, indirectly weighing on the U.S. Dollar Index and reinforcing gold's upside bias. If gold holds above $3,325, a test of $3,360–$3,378 looks increasingly likely in the short term.
Gold is no longer just reacting to data—it’s getting ahead of expectations. Are you?
Gold Weekly Recap – XAU/USD OutlookOANDA:XAUUSD experienced sharp volatility last week as investors reacted to escalating U.S. tariff announcements and shifting expectations around the Federal Reserve’s rate policy. Although prices dropped early in the week, gold quickly bounced back with three consecutive bullish sessions—highlighting strong buying interest amid growing inflation fears and trade tensions.
Analysts remain split: half foresee more upside, while others maintain a neutral stance. Yet, most agree on one thing—gold continues to serve as a defensive fortress during times of uncertainty, especially with markets grappling with both fiscal and monetary headwinds.
Technically, gold is fluctuating within a tight range around 3,360 USD. While no clear breakout from consolidation has occurred, supportive factors like a weakening U.S. dollar, the U.S. national debt surpassing 37 trillion dollars, and safe-haven inflows from reserve funds are helping keep prices stable.
📍If upcoming CPI data or new tariff announcements from the U.S. further pressure the dollar, gold could test the 3,400 resistance level. Otherwise, a sideways trend may dominate if negative news is absorbed smoothly.
Trend Bias: Neutral – leaning bullish if 3,300 holds strong.
So, are you siding with the bulls or waiting for a clear breakout?
Drop your thoughts in the comments! 💬
MAHSEAMLES – Weekly Chart AnalysisStock is showing strong signs of reversal after a prolonged downtrend. A solid base formation is visible, with rising volumes hinting at buyer accumulation.
⚡ Trigger Alert: Good rally expected above ₹800
📈 Watch for upside targets: ₹840 → ₹933 → ₹1010
✅ Rounded bottom pattern
✅ Increasing volume near breakout
✅ Risk-reward looks attractive
📌 Supports: ₹723 / ₹680
🔐 Keep on radar for potential breakout swing or positional setup.
#MAHSEAMLES #TechnicalAnalysis #BreakoutStocks #SwingTrade #VolumeAnalysis #TradingView
Nifty Trading Strategy for 18th July 2025🔼 BUY Setup
📍 Condition: Buy only if 1-hour candle closes above ₹25,200
🎯 Targets:
➤ Target 1: ₹25,235
➤ Target 2: ₹25,255
➤ Target 3: ₹25,285
🛡️ Stop Loss: Below ₹25,170 or as per your risk tolerance.
🧭 Use confirmation from RSI/MACD/Volume before entry.
🔽 SELL Setup
📍 Condition: Sell only if 15-min candle closes below ₹25,070
🎯 Targets:
➤ Target 1: ₹25,040
➤ Target 2: ₹25,010
➤ Target 3: ₹24,970
🛡️ Stop Loss: Above ₹25,100 or per your system.
✅ Instructions & Tips:
🔹 Wait for candle close confirmation before entering.
🔹 Do not jump in on wicks or fakeouts.
🔹 Follow strict risk management (1–2% of capital).
🔹 Always use SL (Stop Loss) and set alerts.
🔹 Check news/events before market hours.
⚠️ Disclaimer:
🔸 I am not a SEBI-registered analyst.
🔸 This analysis is shared for educational and informational purposes only.
🔸 Please do your own research or consult a registered financial advisor before trading.
🔸 Trading and investing in the stock market involve significant financial risk. Proceed at your own discretion.
BANKNIFTY Levels for Today
Here are the today's BANKNIFTY Levels for intraday (in the image below). Based on market movement, these levels can act as support, resistance or both.
Please consider these levels only if there is movement in index and 15m candle sustains at the given levels. The SL (Stop loss) for each BUY trade should be the previous RED candle below the given level. Similarly, the SL (Stop loss) for each SELL trade should be the previous GREEN candle above the given level.
Note: This idea and these levels are only for learning and educational purpose.
Your likes and boosts gives us motivation for continued learning and support.
BANKNIFTY MATHEMATICAL LEVELSThese Levels are based on purely mathematical calculations.
How to use these levels :-
* Mark these levels on your chart.
* Safe players Can use 15 min Time Frame
* Risky Traders Can use 5 min. Time Frame
* When Candle give Breakout / Breakdown to any level we have to enter with High/Low of that breaking candle.
* Targets will be another level marked on chart
* Stop Loss will be Low/High of that Breaking Candle.
* Trail your SL with every candle.
* Avoid Big Candles as SL will be high then.
* This is one of the Best Risk Reward Setup.
For Educational purpose only
Natural gas 312 target hit today holding buy from 282 buy on dipHow My Harmonic pattern projection Indicator work is explained below :
Recent High or Low :
D-0% is our recent low or high
Profit booking zone: D13% -D15% is
range if break them profit booking start on uptrend or downtrend but only profit booking, trend not changed
SL reversal zone : SL 23% and SL 25% is reversal zone if break then trend reverse and we can take reverse trade
Target : T1, T2, T3, T4 and .
Are our Target zone
Nifty may nosedive from here! So that missing piece - closing above 25200 - we lost again.
Reason - FIIs are taking out cash from Indian market as per data.
Why? Because they sense many big companies might report negative earning - hence index trading is not suitable for them.
During Quarterly Earning Season, promoters shift their money from one to another. Mutual funds rebalance their portfolio from weak to stronger. And Institutional Money like FII don't like surprises on their positions. They go with the plan.
If I would have been the FII, what I would be doing is - wait for the earnings to announced and then see which companies have given great results and which have their sales increased. Then, after the Earning Season is over, I'll re-position myself with clean charts. Avoid any volatality. Any surprises.
So that's why they are doing exactly.
Because of that, maybe your setups won't work like they do in usual condition. So if you feel you're getting stuck or Stoloss hitting more than normal, dont be surprised.
A good practice would be to stay away from trading for while and let the market settle for a bounce back.
However, I'm a professional trader and I need to earn in any market condition. Hence I have strategy for every situation.
Me and my students use Earning Pivot to give ourselves an edge against unpredictable market structure during Earning Seasons.
So this would be wise to stick to this setup only for a time being.
Coming to the market, NSE:NIFTY has given a Supply candle today with sellers outnumbering buyers by 93 million volume.
Now if 25000 is broken we can see a deeper cut in the index. Maybe near 24750.
However, the immediate support is at 24980. Resistance now at 25155.
If we get a bounce to this, we can build a short position. Yeah, from now on market might turn on Sell-on-Rise mode.
NSE:BANKNIFTY short term support formed at 56050. Resistance 56965.
Many IPO stocks are showing good strength with bullish structure. Hence I will be focusing there.
Today I traded just one stock and also given here to all of you and that hit Upper Circuit. Remember it was from IPO sector. Name is GETTEX:NSE :#IXIGO.
Traded NSE:ANANDRATHI as Intraday and got 4% upside in that as well. So overall the day ended in positive note for our community. Cheers on that!
That would be all for today. Take care. Have a profitable day ahead.
Silver holding buy from 111750 , we can see new ATH How My Harmonic pattern projection Indicator work is explained below :
Recent High or Low :
D-0% is our recent low or high
Profit booking zone: D13% -D15% is
range if break them profit booking start on uptrend or downtrend but only profit booking, trend not changed
SL reversal zone : SL 23% and SL 25% is reversal zone if break then trend reverse and we can take reverse trade
Target : T1, T2, T3, T4 and .
Are our Target zone
Gold Trading Strategy for 18th July 2025🌟 GOLD INTRADAY STRATEGY – $XAU/USD 🌟
(Based on 1-Hour Candle Close)
📈 BUY Setup
💰 Buy Above: High of 1-hour candle closing above $3353
🎯 Targets:
➡️ 1st Target: $3363
➡️ 2nd Target: $3373
➡️ 3rd Target: $3385
🛡️ Stop Loss: Below recent swing low or as per risk management.
📉 SELL Setup
💰 Sell Below: Low of 1-hour candle closing below $3327
🎯 Targets:
➡️ 1st Target: $3315
➡️ 2nd Target: $3301
➡️ 3rd Target: $3289
🛡️ Stop Loss: Above recent swing high or as per risk management.
📌 Instructions:
✔️ Wait for 1-hour candle to close beyond the breakout levels.
✔️ Confirm breakout with volume and price action.
✔️ Use proper risk-reward ratio and position sizing.
✔️ Ideal for scalping or intraday swing trades.
⚠️ Disclaimer:
📜 This is for educational and informational purposes only. Trading in commodities like Gold ($XAU/USD) involves significant risk. Please consult your financial advisor before making any trading decisions. We are not responsible for any financial losses incurred.
Crude bought at 5650 yesterday also bolked 85 points 5930 targetHow My Harmonic pattern projection Indicator work is explained below :
Recent High or Low :
D-0% is our recent low or high
Profit booking zone: D13% -D15% is
range if break them profit booking start on uptrend or downtrend but only profit booking, trend not changed
SL reversal zone : SL 23% and SL 25% is reversal zone if break then trend reverse and we can take reverse trade
Target : T1, T2, T3, T4 and .
Are our Target zone