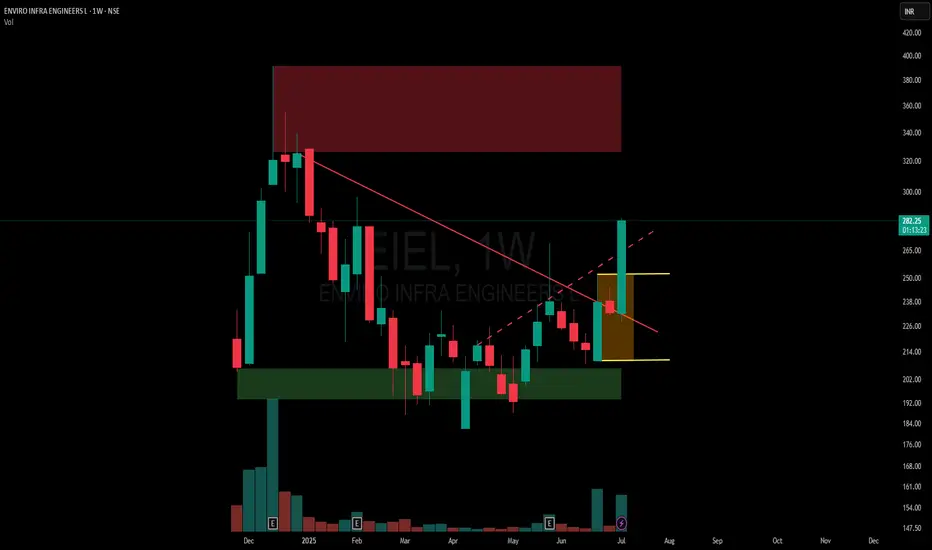
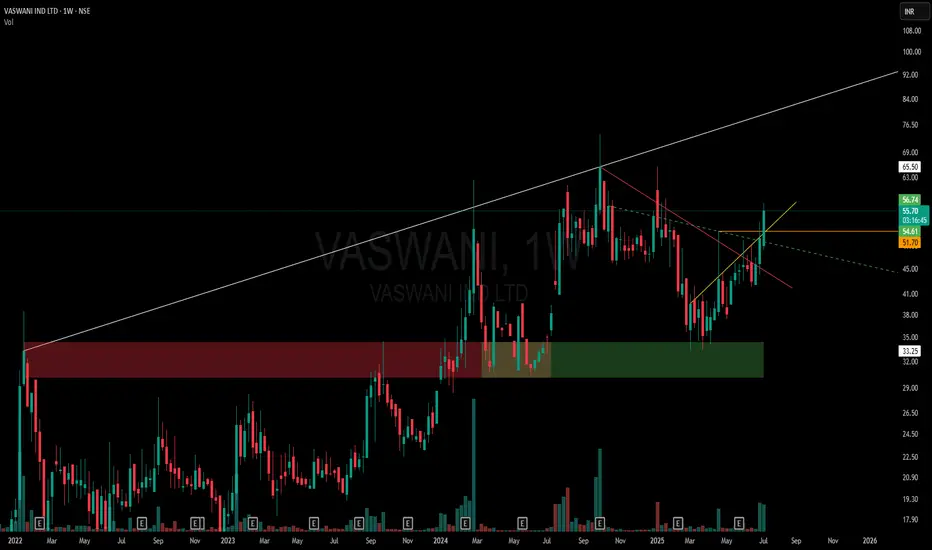
Inside Bar Ignites a Clean Breakout🟢 Simple Breakout Structure | Supply-Demand Flip
✅ Strong demand zone formed after multiple rejections
🔻 Previous supply zone clearly respected
📉 One active counter-trendline broken
🔍 Breakout of mother candle with an inside bar setup
📈 Volume expansion on breakout
🟠 Also broke a hidden resistance line, adding confluence
🧭 Chart structure remains smooth and clear, respecting zones well
No predictions. Just structure.
Trend Analysis
$MCX:SILVERM1! – 13-Year Highs | Holding LongMCX:SILVERM1! just broke above a 13-year resistance, marking a major technical milestone.
We are holding our long position as price shows strong momentum and trend continuation potential.
📊 Highlights:
All-time breakout after more than a decade
Strong trend structure on higher timeframes
Momentum and volume backing the move
✅ Position: Long
📈 Bias: Bullish
⏳ View: Swing / Positional
Letting winners run while the trend is strong.
Watching for follow-through and possible re-entry setups on pullbacks.
Gold Analysis and Trading Strategy | July 11✅ Technical Analysis:
🔸Gold is currently trading within the 3310–3346 range, with a short-term bias toward the upside. After testing 3310 twice yesterday, prices rebounded quickly, indicating strong buying interest below. If the European session sees a breakout and stabilization above 3330, further upside toward 3346 or even 3365 is possible. However, if prices fail and drop below 3310, gold may return to a weaker structure and head toward the 3282–3280 support zone.
🔸 On the 4-hour chart, gold is holding above the middle Bollinger Band, signaling a mildly bullish tone. The Bollinger Bands are narrowing, suggesting a potential breakout toward the upper band. On the 1-hour chart, moving averages are turning upward, breaking the previous downtrend. A candle close above 3330 limits downside correction and offers room for further gains.
🔴 Key Resistance Levels: 3345 / 3365
🟢 Key Support Levels: 3310 / 3300 /3282
⚠️ Key Inflection Level: 3330 (Short-term bullish/bearish pivot)
✅ Intraday Strategy Reference:
🔰If gold breaks and holds above $3330 during the European session, aggressive traders may enter light long positions targeting 3346–3365, with a stop loss at 3315.
🔰If prices face resistance around 3345–3346, consider short entries, with a stop above 3350 and targets back to 3315–3307.
🔰If the 3310 support fails, gold may turn bearish, with downside targets at 3282–3275.
🔰Conservative traders can consider entering long around 3315 with a stop loss at 3307, targeting 3345.
✅ Gold is currently at the tail end of a consolidation range and may soon break out of key technical levels. Traders are advised to control position sizes, remain flexible, and closely monitor U.S. dollar movements, Fed-related statements, and geopolitical developments for potential impacts on gold prices. For real-time trading signals and personalized guidance, feel free to contact me for one-on-one support.
Bullish on INFYYes, Nifty IT has presented a good swing long opportunity on INFY.
Never mind the crash today, the set up looks too promising to not take.
I'm Bullish on INFY with a Target of 1655 for this month series.
Notice how the stock gapped down today and there was immediate buying in the first one hour. This shows Bullish sentiment and this buying has come from a strong Daily price support zone.
P.S. Not a recommendation. Pls do your own due diligence.
Bitcoin Bybit chart analysis July 10Hello
It's a Bitcoin Guide.
If you "follow"
You can receive real-time movement paths and comment notifications on major sections.
If my analysis was helpful,
Please click the booster button at the bottom.
Here is the Bitcoin 30-minute chart.
There will be a Nasdaq indicator announcement at 9:30 in a little while.
There is a high possibility that Nasdaq will shake up and down significantly,
but Bitcoin still looks safe in terms of signal and pattern.
In the analysis article on July 7,
I connected the strategy as it was at the last long position entry point of 107,484 dollars.
*When the red finger moves,
it is a one-way long position strategy.
1. 110,707.4 dollars long position entry point / stop loss price when the sky blue support line breaks
2. 111,783.3 dollars long position 1st target -> Top 2nd -> Good 3rd target price
The 1st section at the top is today's best short position entry point,
and the 2nd section at the bottom is a sideways market.
In the middle, with a pink finger,
I left a re-entry position after liquidating a long position, so
I think it would be good to use it.
From the breakout of the sky blue support line, it can be pushed to Bottom -> 109,116 dollars.
The report is not yet renewed,
but from now on, it will be very important, right?
This week, it seems like it will continue to shake up and down,
so I hope you operate safely with principle trading and stop loss prices.
Thank you.
Swiggy: a probable long trade➡️Entered this with a stop loss of 374
➡️21 ema support
➡️Consumption theme has been picking up and I am hopeful that this scrip would be a beneficiary of the theme
➡️supply zone may act as a demand zone
➡️the volume on negative days have been meagre in comparison to the volume on positive days
Green or Red Which path Bajaj Finance will take ?Bajaj Finance is currently consolidating, showing potential for a strong move in either direction. A bullish breakout could lead to an uptrend, while a bearish breakdown may signal a decline. The stock is forming a base, and whichever path it takes next may define its trend for the coming weeks.
BLUESTARCO: Cup and Handle?A smooth cup followed by a handle is being formed in BLUESTARCO.
As shown in the idea, in the past BLUESTARCO has formed similar patterns thrice and gave a nice upward movement soon after.
But in all earlier cases the handle was formed above the support of 1875 but now it is being formed at resistance.
Watch how the stock behaves and take position accordingly.
7.11 Gold Analysis7.11 Gold Analysis
At present, the long and short forces are in a tug-of-war between three key factors:
1. Expectations of Fed rate cuts (core support)
Latest developments: Fed Governor Waller strongly called for a rate cut in July, but the market expects a rate cut in September with a probability of over 70% (CME data). The chairman of the San Francisco Fed expressed support for two rate cuts this year to ease inflation concerns.
Influence mechanism: Rate cuts will lower real interest rates and the US dollar exchange rate, significantly reducing the cost of holding gold. If subsequent CPI/PPI data are weak or the job market deteriorates, the rally may be triggered in advance.
2. Middle East geopolitical risks (pulse momentum)
Event escalation: The Israeli Defense Minister threatened to strike Iran again, and the risk of obstruction of Red Sea shipping increased.
Risk aversion logic: If the conflict breaks out in substance (such as an attack on oil facilities), it will trigger a safe-haven fund to flow into gold. At the same time, the surge in oil prices may push up global inflation and strengthen the anti-inflation properties of gold.
3. Trump's tariff policy (stagflation catalyst)
Policy impact: 50% tariff on Brazilian goods and imported copper (effective on August 1), triggering global supply chain disturbances.
Double effect: Pushing up the US dollar in the short term will suppress gold prices, but it may aggravate stagflation risks in the medium and long term, providing underlying support for gold.
Key contradiction conclusion:
The expectation of interest rate cuts is the cornerstone of gold's trend rise, and geopolitical and tariff risks provide breakthrough momentum. If the three resonate (such as escalation of conflicts + September interest rate cuts + tariffs push up inflation), gold prices may quickly hit above $3,400.
Technical multi-cycle analysis
Daily level
Pattern structure: Gold has fallen from the April high of $3,500, forming a triangular convergence pattern. After breaking through the previous high resistance of $3,346 and standing firm, it will enter the $3,350-3,374 oscillation box. MACD shows a golden cross signal, and RSI stands firm in the neutral zone of 55, indicating that bulls are accumulating power.
Key watershed:
Upward breakthrough point: $3374 (0.618 Fibonacci retracement level + previous daily high), after stabilization, it will open up the 3400-3420 space.
Downward risk point: $3330 (10-day moving average + triangle upper rail), if it fails, it may drop to 3310-3280 support.
Short cycle (4H/1H)
4-hour chart: The price runs in the rising channel (lower edge 3340/upper edge 3372), and the narrowing of the Bollinger Bands indicates that a breakthrough is imminent. Pay attention to the $3345 moving average support, and maintain the offensive if it holds.
1-hour chart: MACD top divergence repair is completed, and the high point of $3340 breaks through and stabilizes, which will trigger short-term follow-up buying.
Today's key events and trading windows
US June PPI annual rate: If the data is lower than the previous value of 2.2%, it will strengthen the logic of interest rate cuts and push up gold prices;
Federal Reserve Board member Waller's speech: Dovish remarks may become a catalyst for breaking through $3,346;
Israel Security Cabinet Meeting: Any signal of military action will trigger safe-haven buying.
Today's strategy
It is recommended to buy around 3,320, stop loss at 3,300. Target 3,340.
If my analysis can help you, I hope you can cheer me up.
EURUSD – Failed Breakout, Bearish Momentum Takes OverEURUSD attempted to break out of the upper edge of a consolidation triangle but was swiftly rejected around the 1.17450 region, forming a classic “failed breakout” — a pattern that often precedes strong reversals. The pair is now pulling back and appears to be heading toward the 1.16800 support zone.
On the news front, the market is under pressure from rising expectations that the Federal Reserve will maintain higher interest rates for longer, following stronger-than-expected U.S. job data. This has driven a notable recovery in the U.S. dollar, putting downward pressure on the euro. In this context, EURUSD risks a deeper correction if the 1.1700 support fails to hold. Keep a close eye on price action — this pullback could be the start of a new bearish leg.
USDJPY – Is the Downtrend Taking Shape?On the H4 chart, USDJPY shows signs of weakening as it repeatedly fails to break above the long-term descending trendline. Despite a recent recovery toward the 147.000 level, buying momentum appears to be fading. The price structure suggests the possibility of a false breakout before a reversal toward the 144.300 support zone—an area with multiple unfilled FVGs.
From a news perspective, traders are awaiting today’s upcoming U.S. CPI report. If inflation data comes in hotter than expected, the USD may gain short-term strength. However, a weaker CPI reading could trigger a quick reversal in USDJPY, confirming the bearish setup. The 147.000 level remains the critical zone to watch for any potential rejection or breakout.
One-Sided Broadening Pattern | Pure Price Action Storytelling🔹 White Line: Captures the expanding higher-high resistance zone — part of the broader one-sided broadening pattern. Each new high is breaching the prior, giving the top side its expanding identity.
🔹 Horizontal Zone (Red to Green Shift): What once acted as a strong supply zone now flipped to a demand zone — price has respected this region multiple times, marking its evolution.
🔹 Red Line: A clean Counter-Trendline (CT) containing multiple touches, recently broken.
🔹 Yellow Line: A hidden diagonal resistance — tight and respected — offering another layer of confluence.
🔹 Green Dotted Line: Subtle hidden support built over time — watch how the structure was reacting along this line.
🔹 Orange Line: Marks wick-based rejection from a recent swing — subtle but clear evidence of supply exhaustion on that specific level.
🧠 This chart is not about predictions — it's about how beautifully price respects structure when drawn with logic and precision. Just charting. Just behavior. Just price.
Swing and Positional Trade Setup ✅ Final Setup for Positional and Swing Trades (High Beta Liquid Stocks for Cash and Options)-
This trading guide outlines a simple and effective setup for both positional and swing trades, focused on high beta, highly liquid stocks. Follow the rules strictly for better consistency and profitability.
🔹 Positional Trade Setup
• Open the Monthly Chart of the stock.
• Add the RSI (Relative Strength Index) indicator.
• Uncheck all levels (30, 50, 70) and only keep one level at 60.
• Edit the level from 70 to 60 and highlight it in green.
Entry Criteria:
• Stock must cross the 60 RSI level on the monthly chart.
• Entry is only triggered if the price breaks the previous month's high.
Stop Loss:
• Place the initial stop loss below the previous month's low.
Trailing Stop Loss:
• Trail the stop loss to the current month’s low, but only after the monthly candle closes.
• Continue trailing the stop loss every month using this method until exit.
Exit Rule:
• Exit the positional trade only if the current month’s candle closes below the previous month’s low.
⚡ Note: The RSI 60+ setup is a powerful momentum strategy with high reward probability.
🔹 Swing Trade Setup
• Monthly RSI must cross above the 60 level.
• Switch to the Daily Chart of the stock.
• Identify the current swing high on the daily chart.
• Entry is triggered only when the stock breaks the swing high.
• Place the stop loss below the previous week low at first.
Trailing Stop Loss:
• If the trade moves in your favor, trail the stop loss to cost from week low.
Exit Rule:
• Exit the swing trade only if RSI crosses below 60 with a daily candle close.
📌 High Liquid Stocks List
(Suitable for both Cash and Options Segment)
🚗 Auto
• Bajaj Auto
• Bosch Ltd
• Eicher Motors
• Hero Motocorp
• Maruti Suzuki
• TVS Motors
• Tata Motors
🏦 Banking & Financial Services
• Bank of Baroda
• Kotak Bank
• Axis Bank
• ICICI Bank
• HDFC Bank
• IndusInd Bank
• Bajaj FinServ
• Bajaj Finance
• SBI
🧪 Chemicals
• Aarti Industries
• Atul Ltd
• Navin Fluorine
• UPL
• Tata Chemicals
🍫 FMCG
• Britannia
• Godrej Consumer
• Tata Consumer
• DMart
• Hindustan Unilever
• Dabur
💊 Pharma & Healthcare
• Apollo Hospitals
• Alkem
• Biocon
• Divis Labs
• Dr. Reddy’s
• IPCA Labs
• Laurus Labs
• Lupin
• Aurobindo Pharma
• Sun Pharma
• Cipla
💻 IT Sector
• HCL Technologies
• Infosys
• LTIM
• TCS
• Tech Mahindra
• Wipro
⛓️ Steel & Metals
• APL Apollo
• JSW Steel
• Jindal Steel
• Tata Steel
• Hindalco
• L&T
🛢️ Oil & Gas
• Reliance Industries
• Gujarat Gas
• IGL
• MGL
• Tata Power
🏢 Realty
• DLF
• Godrej Properties
• Lodha
• Oberoi Realty
• Phoenix Mills
🛋️ Durables & Others
• Sona BLW (Sonacoms)
• Amber Enterprises
• Bata India
• Crompton
• Dixon Technologies
• Titan
• ACC Cement
• Ambuja Cement
• Ultratech Cement
• Voltas
• Polycab
• Mazdock
• Asian Paints
• Berger Paints
📝 Conclusion
This is the final and simplified setup designed for traders looking for clarity and consistency in trading. No complicated indicators or confusing rules—just clean chart action with momentum logic. Please don't trade Intraday and Index options - its a TRAP.
FarazT
Sr. Equity Research Analyst
Gold Struggles Under Tariff Pressure Hello everyone, great to see you again!
Today, OANDA:XAUUSD remains under notable pressure as the U.S. continues to signal a tougher trade stance. The latest move: the U.S. President announced a 50% import tariff on copper and a potential 200% tariff on pharmaceuticals, following a previous tariff notice ranging from 25% to 40% sent to 14 countries — including Japan, South Korea, Thailand, and Malaysia.
This isn’t just about protectionism. These measures fuel fears of global inflation, supply chain disruptions, and a broader economic slowdown. With surging prices in raw materials and essential goods, consumers may be forced to cut back spending, a classic warning sign for future growth.
In this environment, investors had hoped gold would shine again as a safe haven asset. However, the recent bullish momentum has been underwhelming, signaling ongoing market hesitation.
📉 On the H4 chart, XAUUSD is being squeezed into a descending pattern, which typically carries a high probability of a downside breakout. If the current support fails, the next target could fall below the 32xx area.
On the flip side, if supportive news emerges — such as a hint of rate cuts from the Fed — gold must break above the $3,335 level to revive bullish sentiment.
🔎 What do you think? Will gold break lower — or bounce back? Drop your thoughts below!
BITCOIN NEAR COMPLETOIN OF ITS CYCLEHere ploted fib circle which is showing what i want to say you all and what i told in my previous post you can see here resistance and symmetrical triangle is ploted as it is now you should be carefull however it has potential to go up but it may take some rest after squaring its previous price.Cycle is going to comlete but squaring is remained to comlete even after this biger move.this is not my buy/sell call just informing you all.
BUY TODAY SELL TOMORROW for 5%DON’T HAVE TIME TO MANAGE YOUR TRADES?
- Take BTST trades at 3:25 pm every day
- Try to exit by taking 4-7% profit of each trade
- SL can also be maintained as closing below the low of the breakout candle
Now, why do I prefer BTST over swing trades? The primary reason is that I have observed that 90% of the stocks give most of the movement in just 1-2 days and the rest of the time they either consolidate or fall
Cup and Handle Breakout in MAMATA
BUY TODAY SELL TOMORROW for 5%
ETHUSD Trade Setup – 15Min Chart UpdateEthereum respected the rising channel structure throughout the session, maintaining higher highs and higher lows. After a brief correction, ETH has once again bounced from the lower trendline support of the ascending channel.
🚀 Entry has been triggered right off the channel support zone, indicating bullish momentum is still intact.
📌 Key Levels:
Entry: Near $2783
Stop Loss: Below $2753
Target: $2809 and beyond
This setup offers a favorable risk-reward ratio, with strong structure-based confidence. As long as the trendline holds, bullish continuation is likely.
Anand Rathi Wealth Limited (ANANDRATHI) Company: Leading non-bank wealth solutions provider in India with ₹75,291 Cr AUM, serving HNIs/UHNIs with market cap of ₹17,681 Cr.
Technical Pattern: Stock forming descending triangle with resistance at ₹2,300-2,350 and critical support at ₹2,150-2,200; currently down 4.63% at ₹2,218.
Key Levels: Break above ₹2,300 targets ₹2,500+, while break below ₹2,150 could test ₹1,900-2,000 support zone.
Fundamentals: Strong client retention (59% clients >3 years), low RM attrition (0.56%), benefiting from growing Indian HNI segment.
Outlook: Stock at critical juncture - wait for decisive directional move with volume confirmation before taking positions.