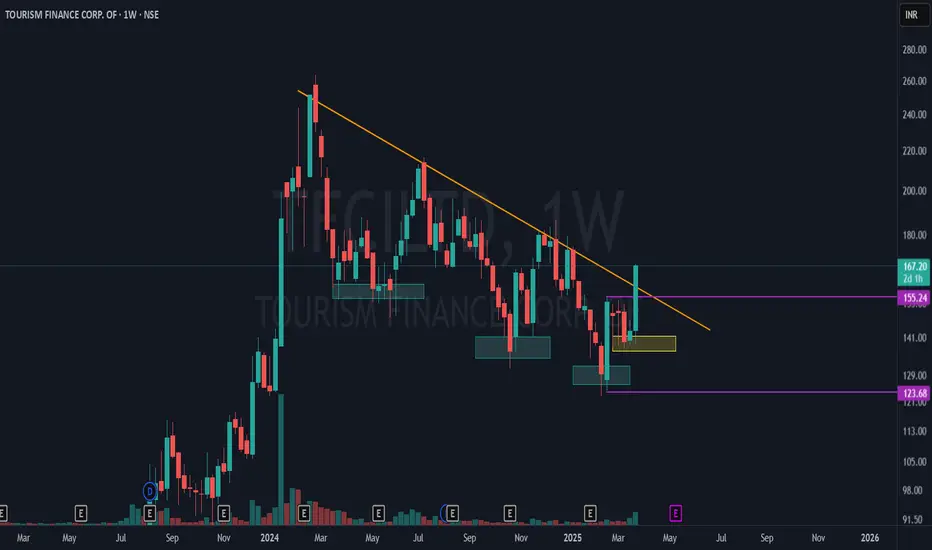
Tourism Finance Corp - Major Breakout in Progress!TFCI is showing a significant market structure shift on the weekly time frame (WTF) with strong confluence of technical signals! 📊
🔹 Lower Lows to Higher Low Transition:
Blue boxes indicate a series of lower lows, reflecting a prior downtrend.
The yellow box highlights a higher low, signaling a potential trend reversal!
🔹 Mother Candle Breakout:
The purple lines mark the high and low of the mother bar (key range).
Price is now breaking out from the upper side of the mother candle, confirming bullish momentum.
🔹 Counter Trendline (CTL) Breakout:
The orange line represents the main CTL on the weekly timeframe.
Price is successfully breaking out, indicating a potential trend shift to bullish!
Comment below your thoughts
Trading
EURUSDIf you go on 4H you can see to the left in the last couple of months EurUsd has consistantly been making HH and it has been in an up trend, however on Monday market open price has made an important new leg and new Trading range was made. Not the strongest one yet, however suitable for looking for trades. On the rigth side of the screen you can see I where I have looked for a trade opportunity. If you zoom in on an 15 min time frame you can see great short opportunities today, 2 to be exact. Waiting for price to drop and take out the most recent low. Now there is more of a educational explenation while on 15min you can go and see what is happening into the region where the price is currently sitting at.
Blessings, T
Will TON/USDT Hit $100 in Near Future? $TONCOIN – Technical Analysis Update
CRYPTOCAP:TON is currently displaying a bullish structure, following a strong bounce from the key support/retest zone at $2.50.
🔹 Support Zone: $2.50
🔹 Accumulation Range: $3.50 – $2.50
🔹 Trend Outlook: As long as price sustains above $2.30–$2.50 zone, the structure remains bullish.
📈 Potential Upside Targets:
▪️ $20
▪️ $30
▪️ $40
▪️ $50
▪️ $100 (macro target on long-term breakout)
🔻 Invalidation Level (Bearish Bias):
If CRYPTOCAP:TON breaks below $2.30 and fails to reclaim it, bearish momentum may resume.
📝 Disclaimer: This is a technical analysis view, not financial advice. Always DYOR before making any investment decisions.
Piramal Pharma Yet to Breakout? | MotherBar + CT + Supply DemandPiramal Pharma Ltd is at a critical juncture! 🚀 The stock is consolidating within a counter trendline (CTL) while respecting the rising trendline support.
Key highlights:
✅ Mother Candle Formation - A large weekly candle acting as a range.
✅ Counter Trendline Breakout Watch - Price is still testing resistance, a breakout could trigger momentum.
✅ Demand Zone Support - The highlighted zone could act as a buying area.
✅ Volume Analysis - Increasing volumes hint at potential accumulation.
Will this breakout or get rejected? Let’s watch price action carefully! 📊🔥
Gold at the Crossroads: Will 3000 Hold ?Technical Observations
1. Support Levels
- Immediate Support: 3,000 (Psychological Level)
- Additional Support Levels:
- Potential Re-Buy Area: Around 2,900-2,910
2. Resistance Levels
- Current ATH zone marked with a question mark
Market Sentiment
- Bulls remain in control above 3,000
- Potential scenarios:
a) Hold above 3,000: Possibility of retesting or creating new ATH
b) Break and close below 3,000: Potential short to mid-term correction
Key Trading Considerations
- Critical Level to Watch: 3,000 support
- Bullish Scenario: Sustained trading above 3,000
- Bearish Warning: Decisive break and close below 3,000
XAU#25: Is the correction over? What's next?Prices OANDA:XAUUSD stabilized around $3,022/ounce after a slight decline two days ago, reflecting strong safe-haven demand due to economic and geopolitical uncertainty. So is this correction over? Let's look at the next plan FOREXCOM:XAUUSD :
1️⃣ **Fundamental analysis:**
📊 Risks of economic recession and war conflict still exist:
🔹The Trump administration's reciprocal tariff policy may be more moderate than expected, reducing concerns about trade conflicts, but Wall Street is still betting on a 50% chance of a US recession due to slow currency circulation. This is one of the factors supporting Gold's rise
🔹 Risks from the Middle East and Ukraine are still unknown. Negotiations are still reaching certain agreements, but the impact on market confidence is insignificant. The fear psychology is still pushing money into Gold as a safe haven asset.
2️⃣ **Technical analysis:**
🔹 **D Frame**: The uptrend remains unchanged. Closing the session last Friday with a bearish candle is considered a profit-taking move after a series of days of gold price increase.
🔹 **H4 Frame**: The 3000 area is playing an effective support role when the price bounces back. However, the correction wave has not shown any signs of ending.
🔹 **H1 Frame**: The bearish price structure is very clear. If the 301x area is still held, the price may seek the resistance zones above to confirm the price reaction.
3️⃣ **Trading plan:*
✅ From the basic information to the reflected horizontal line, it can be seen that at the present time, the price can still continue to decrease. However, there are certain risks when FOMO establishes a SELL position in the current area. The price may not drop deeply to the lower area immediately but will sweep SL at both ends. We can wait for the price reaction in the upper resistance area to find a safer position.
💪 **Wishing you success in achieving profits!**
Gold Outlook – Breakout or Pullback in the Final Week of March?🧠 Final Week of March: Will Gold Break Out or Pull Back? Complete Market Outlook + Trade Plan for XAUUSD
🌐 1. Fundamental Overview – Macro Factors Driving Gold
Gold experienced a sharp $50+ correction last week after printing new all-time highs. The recent price action was shaped by several key macroeconomic factors:
🔸 The Federal Reserve held interest rates steady and delivered a more cautious tone — suggesting no immediate rate cuts, which strengthened the USD and put pressure on gold.
🔸 US Dollar Index (DXY) recovered above the 104 mark, adding bearish momentum for XAUUSD.
🔸 Upcoming US inflation data (PCE this Friday) is the main event of the week — market participants are positioning cautiously ahead of this.
🔸 End-of-quarter fund flows may trigger erratic moves and profit-taking, especially as institutions rebalance portfolios.
Despite this pullback, late-week buying activity suggests that buyers are still defending key zones, and the medium- to long-term bullish structure remains intact.
📈 2. Technical Analysis – Chart Structure & Price Action
✅ Market Context:
Price broke out of the short-term ascending channel but is still respecting the major uptrend structure
Currently testing support zones with potential for either continuation or deeper correction
Key zone around 3,013.67 is holding for now, but volatility is expected
🆕 Monday Opening (March 25, 2025) Update:
Gold opened with weakness after a brief end-of-week bounce
Price is currently stalling at a key Fibonacci retracement area (0.5–0.618) on H1/H2
Buyers have lost momentum, suggesting a consolidation or second leg down may be forming
🔁 Scenarios:
🟢 Bullish Scenario:
Price holds above 3,000 / 2,987 zone
Rebound to test 3,031.80 → breakout → targets 3,046.38 and 3,057.58
🔴 Bearish Scenario:
Failure to hold 3,000 → break below 2,987 → opens downside continuation
Price could revisit deeper demand zones below (e.g., 2,970–2,950)
📌 Key Levels:
Resistance: 3,031- 3,046 - 3,057
Support: 3,013 - 3,000.33 - 2,987
🎯 TRADE PLAN – XAUUSD
BUY ZONE: 3000 – 2998
SL: 2994
TP: 3004 – 3008 – 3012 – 3016 – 3020
SELL ZONE: 3030 – 3032
SL: 3036
TP: 3026 – 3022 – 3018 – 3014 – 3010 – 3000
Trade within reaction zones. Prioritize partial profits and always protect your capital with tight SLs.
✅ Conclusion:
Gold is still technically bullish but in a corrective phase
Market awaits confirmation from either bulls or bears before a clean breakout
News flow + macro data (PCE) will be key catalysts this week
Stay patient, trade the levels, and let price action lead
— AD | Money Market Flow
BTC#22: BTC recovers slightly. Is the bear wave over?
In the past few days, BINANCE:BTCUSD has been continuously SW in the 81~85k area. Is this a sign that BTC will rise again? Let's analyze in detail and plan a trade BINANCE:BTCUSDT :
1️⃣ **Fundamental analysis:**
📊 The IMF has included Bitcoin and other digital assets in the framework of the global economic report for the first time. This shows that BTC is being recognized as a real asset.
🚀 The probability that the US government will buy Bitcoin in 2025 is 30% with information that the Trump administration may use profits from Gold to increase Bitcoin reserves
2️⃣ **Technical analysis:**
🔹 **Frame D**: the bear wave has not shown any signs of ending. The price has been anchored in the 80~85k area for a long time, but there has been no significant fluctuation and the sign of recovery is still unclear.
🔹 **H4+H1 frame**: The current short-term price structure is temporarily increasing with the appearance of higher peaks and higher bottoms. However, the price has not surpassed the important key zone to change the main trend.
3️⃣ **Trading plan:*
📌 At the present time, the current price has no clear signs when BTC is still fluctuating continuously in the SW area. Currently, the price is in a recovery phase with the nearest target being the resistance area of 88~91k. The current area is also not good for seeking profit from BUY positions. We can wait for the price reaction to the resistance area to consider establishing a SELL position. Prioritize trading in accordance with the main trend.
💪 **Wish you success in making profits!**
Torrent Power – 50% Fibonacci Retest & Breakout Play!📊 Technical Breakdown:
🔹 50% Fibonacci Retracement at ₹1,212 – a crucial support where buyers stepped in!
🔹 Falling trendline breakout with a massive +16.06% green candle – trend reversal confirmation?
🔹 Volume surge suggests strong buying interest but relatively still lower than as it used to be in this stock year ago
🔹 Blue and Red lines are nearest supply zone created by a weekly and monthly time frame
Smallcap 100: No trades yetNIFTY SMALLCAP
➡️My customised indicator telling me to wait. This is one of the tools I use to decide the market breadth.
➡️When the index is above the channel, the chances of getting trades right and extremely rewarding are higher.
➡️Below it, it’s not the most conducive trading environment especially in smallcap.
➡️Not jumping onto new positional trades as of now.
L&T Finance Weekly Breakout Setup 🔹 Green Line – The weekly support held strong, giving a perfect WTF (Where's The Floor) bounce.
🔹 Supply Zone (Blue Box) – This crucial resistance has now been broken out convincingly.
🔹 Red Line – A CT (Counter-Trendline) breakout with solid volume confirmation.
🔹 Bright Blue Line (MTF Resistance @ 185.82) – The toughest resistance, but it's far from the breakout zone, making this a high-RR trade idea.
🔥 Unique setup with multiple confluences! Volume spike adds conviction. Can bulls sustain the momentum? 🤔
📈 What’s your take on this breakout? Comment below! 👇
Gold Next Move: 3000 Loading... Key Observations to Current Price Action:
- Recent price action shows a strong impulsive move up from the green support zone (2770-90)
- The current structure suggests that we're potentially entering a corrective phase followed by continuation of the bullish trend as marked with black arrows.
- The green zone that I marked on chart can act as an institutional support level or "fair value zone" where significant trading activity has occurred,The recent breakout above this level with strong momentum suggests institutional buying pressure
- The anticipated pullback could represent a potential "discount" zone where smart money might accumulate or re enter.
The pullback, if it materializes, should ideally hold above the green support zone to maintain bullish market structure.
The overall price action still showing a bullish bias with a potential short-term correction before continuing higher. The green zone will be crucial for maintaining this bullish scenario.
I am still holding buy trade on Gold and Silver and will add more if I see confirmation from lower area (Marked in Red circle) for the target of 3000.
Gold Analysis -MMF- Profit-Taking Signals Opportunity🚀 Critical Levels Today! 📊
✅ Yesterday’s Recap: Our previous analysis hit around 90% accuracy 🎯, with gold responding perfectly at historical highs, prompting traders to book profits early in the European session. The bearish momentum is continuing into today's Asian session. 📉
📌 Market Sentiment:
Profit-taking is the primary driver at these historic highs. Investors are carefully eyeing lower liquidity zones for re-entry, positioning themselves strategically for future gains as global economies lean towards rate-cut cycles and an era of cheaper money. Historically, such cycles strongly favor gold prices. 🌟💰
📌 Technical View:
Technical signals align closely with fundamentals: reversal signals at recent highs are mild, suggesting cautious profit-taking rather than aggressive short-selling. Gold traders are merely scouting temporary peaks cautiously, not heavily bearish yet. ⚠️🔍
📉 Critical Levels:
🛑 Resistance: 3038 | 3046 | 3056 | 3070
🟢 Support: 3030 | 3025 | 3014 | 3005
Currently, gold has broken the bullish H1 channel, testing immediate support at 3025. A strong breakdown below this level could trigger deeper bearish moves, especially today—Friday volatility could drive intense movements targeting lower liquidity zones. 🔻🔥
🎯 Strategic Trading Zones:
🚨 BUY ZONE: 📈
Entry: 3006 - 3004
Stop Loss (SL): 3000 🛡️
Take Profit (TP): 3010 | 3015 | 3020 | 3025 | 3030 🎯
🚨 SELL ZONE: 📉
Entry: 3056 - 3058
Stop Loss (SL): 3062 🛡️
Take Profit (TP): 3052 | 3048 | 3044 | 3040 | 3035 | 3030 🎯
⚡ Today’s Action Plan:
Focus closely on Asian & European sessions. Updates will be provided ahead of the US session, anticipating high volatility and profit-booking activities. Stay disciplined, strictly adhere to your TP & SL to protect your account! 🙌💼
Pcbl Chemical – Supply Turned Demand, Higher Lows & Breakout Set📊 Stock: PCBL CHEMICAL LTD (NSE) – 1W Chart
📈 Bullish Structure Developing!
Supply turned into demand! Initially, the stock faced a strong supply zone, leading to a correction and consolidation.
Breakout & Sustained Move – After breaking out, the stock sustained above the breakout level for a long period, confirming demand at this zone.
Higher Lows Formation – A classic bullish structure is developing, indicating accumulation.
CT Base Breakout Approaching – The stock is breaking out of a contraction phase, which could lead to further upside.
Volume is a concern, but price action remains strong. A volume pickup could fuel a stronger move! 🚀
💬 What’s your take on this setup? Are you tracking PCBL? Drop your thoughts below! ⬇️
Godrej Agrovet – Breaking Out After 245 Days of Consolidation!📊 Stock: GODREJ AGROVET LTD (NSE) – 1W Chart
📈 Breakout Alert!
The stock has been consolidating for 245 days and is now breaking out with strong momentum!
Hidden trendlines (yellow) indicate potential future price movement zones.
Red trendline (CT) – Key resistance trendline that has been broken.
Green trendline – Strong support area that held firm.
Blue line marks the nearest all-time high based on multi-timeframe closing levels.
With strong market participation and volume, this breakout looks promising! 📊🚀
💬 What are your thoughts on this breakout? Are you tracking this stock? Comment below! ⬇️
Gold PA on week close : Profit-Taking or Trend Reversal? Gold is currently showing signs of a pullback after its strong bullish run, trading at 3,031.975 . This consolidation was anticipated in yesterday's update as a "healthy pause" following the impressive momentum .
Current current PA Status:
- Gold has pulled back from recent highs and is currently trading below the R2 resistance level (3,046.317)
- Price action is showing some selling pause in rally but remains within the projected consolidation range (3,030-3,060) that shared yesterday
- The higher high (HH) structure on the daily timeframe remains intact despite yesterday's pullback
Technical Observations
- The pullback is occurring exactly as predicted in yesterday's secondary scenario
- Current price action suggests profit-taking after reaching near the R2 level
- Gold is still trading well above the psychological 3,000 support level
- The pullback appears orderly rather than panic-driven
Updated Projections
**Primary Scenario (Bullish After Consolidation)**
- Current pullback represents normal profit-taking after the strong upward move
- Support around 3,000 should hold if bullish momentum remains intact or price need to break above yesterady high to see continuation.
- Once consolidation completes, gold likely resumes its upward trajectory toward R3 (3,136.323) as I am still execting one more week of strenth as per daily cycle timing.
Secondary Scenario (Correction)
- If today's close remains weak, we could see further pullback toward the 3,000 psychological level
- A break below 3,000 would suggest a deeper correction toward R1 (2,952.228)
Key Levels to Monitor
- Immediate resistance: R2 (3,046.317)
- Current support: 3,030 and then 3000 area
- Critical support: 3,000 psychological level and previous week low
Today's price action confirms yesterday's analysis about potential consolidation. Wait for today's closing price to determine if this is merely a pause in the bullish trend or the beginning of a deeper correction. The overall trend remains bullish as long as the price stays above 3,000 and the HH structure on the daily timeframe remains intact.
Hedera (HBAR) Spot Trade SetupWith HBAR trading at a key support level, this presents a solid long opportunity if buyers step in to defend the zone. A successful bounce could push the price towards key resistance levels.
🛠 Trade Details:
Entry: Around $0.18 (Support Level)
Take Profit Targets:
$0.25 - $0.285 (First TP Zone - Initial Resistance)
$0.35 - $0.39 (Second TP Zone - Major Resistance)
Stop Loss: Just below $0.175
Watching for bullish confirmation before entry. 🚀
Gold Price Action Analysis - March 20, 2025Gold Price Action Analysis - March 20, 2025
Current Market Status
- Gold is currently trading at 3,050.055,
- Successfully conquered the R2 resistance level (3,046.317)
- Showing strong momentum with minimal retracement or consolidation
- Psychological level of 3,000 has been comfortably established as support
Technical Observations
- The price is following almost exactly the projected path that I shared on Monday (blue arrow)
- Minimal upper wicks on recent candles indicate buyers are maintaining control
- Volume appears to be supporting the move higher
- No divergence signals on the daily timeframe indicating weakness
Updated Projections
Primary Scenario (Continued Bullish Momentum)
- Having broken through R2 (3,046.317), gold is now likely to target R3 at 3,100
- The absence of significant profit-taking suggests potential for further upside
- Watch for a potential acceleration if momentum continues to build
Secondary Scenario (Short-term Consolidation)
- After such a strong move, an intraday pullback or consolidation may occur
- Potential consolidation range: 3,030-3,060
- This would be a healthy pause before the next leg up
- The overall bullish structure remains intact as long as price stays above 3,000
Key Levels to Monitor
- Immediate resistance: 3050-55 and 3100, then 3,136.323 (R3)
- Current support: 3,046.317 (previous R2, now potential support)
- Secondary support: 3,000 (psychological level)
- Critical support: 2,952.228 (R1)
Trade Considerations
- Overall outlook is still bullish while being cautious of potential short-term overbought conditions
- Consider partial profit-taking at 3100 0r R3 (3,136.323) if reached
- Potential dips toward 3,030-3,040 range could offer strategic entry points for traders looking to add to positions for Intra day on confirmations
Gold continues to demonstrate exceptional strength with no technical signs of weakness on higher timeframes. While an intraday pullback is possible, the primary trend remains firmly bullish.
Gold Price Analysis Update - March 18, 2025Gold continues to demonstrate exceptional bullish momentum, validating yesterday's primary scenario prediction shared here. Currently trading at 3,010.965, gold has surged past the R1 target of 2,952.228 as forecasted and is now approaching the R2 resistance level at 3,046.317.
Current Market Conditions
-Successfully sustaining on the 3,000 psychological barrier
- Trading well above the previous all-time high (2,956.73), which is now serving as strong support
- The chart shows minimal retracement following the breakout, indicating robust buying pressure
Updated Projections
1. Primary Scenario (Continued Bullish Momentum): Gold is likely to test the R2 resistance at 3,046.317 in the near term. With current momentum, a push toward R3 at 3,136.323 remains a strong possibility.
2. Secondary Scenario (Minor Consolidation): We may see brief consolidation around current levels before the next leg up. However, as long as price remains above 2,952 (R1), the bullish outlook remains intact.
Key Levels to Monitor
- Immediate resistance: 3,046.317 (R2)
- Extended target: 3,136.323 (R3)
- Support levels:$2,952.228 (R1, previous resistance now support)
Market Sentiment
The strong daily close with minimal upper wicks indicates buyers remain in control with no significant profit-taking yet. The overall trend structure remains intact with higher highs and higher lows, confirming the bullish bias.
Gold's performance likely continues to be supported by geopolitical tensions, inflation concerns, and potential monetary policy adjustments. With no technical weakness apparent on the daily timeframe, maintain bullish outllok overall.
Tanla Platforms Swing -Double Bottom + CT Breakout with Volumes 📈 Technical Breakdown:
Double Bottom Formation at the base, signaling a potential reversal (though weak).
CT Breakout on the Daily Timeframe (DTF) (White Line).
Higher Timeframe (WTF) Resistance Zones marked by Yellow Lines, acting as hidden reactive resistances.
Massive Volume Spike Today – the highest in recent times, confirming strong breakout momentum.
🎯 Trade Idea:
A clean breakout from the CT with blasting volumes suggests a 1:1 trade opportunity at max for now.
Price might face resistance at higher levels, aligning with the yellow CT lines.
Need to watch if price sustains above the breakout zone for further continuation.
💬 Huge volumes—smart money stepping in or a trap? What’s your view? Let me know in the comments! 👇
US Dollar Index (DXY) – Pre-FOMC Update💥 US Dollar Index (DXY) – Pre-FOMC Update: Expert Analysis and Trading Strategies 💥
In just a few hours, the Federal Reserve (Fed) will announce its interest rate decision and update its economic projections in the Summary of Economic Projections (SEP). This is a highly anticipated event that will shape trading decisions in the coming weeks. The US Dollar Index (DXY) is currently fluctuating within the 103.00 - 104.00 range, reflecting investor caution ahead of the critical updates.
1. Interest Rate Decision and Its Impact on DXY
The policy rate is expected to remain unchanged at 4.25% - 4.50%. However, the market is more focused on signals about future rate cuts, particularly in 2025.
Chair Jerome Powell's post-meeting speech will be the key driver. The market will closely watch for hints on monetary policy, inflation, and the US economic outlook.
If the Fed adopts a hawkish tone (indicating sustained high rates or even further hikes), the DXY could rally strongly. Conversely, a dovish signal could weaken the USD.
2. Technical Analysis of DXY
🔴 Key Support: 103.18
The DXY is currently under pressure at the 103.18 support level. A break below this level could push the index further down to 103.00 or even 102.50.
This is a crucial zone, as failure to hold here would signal continued USD weakness in the short term.
🟢 Major Resistance: 105.00 and 105.57
If the DXY rebounds from current support levels, the next challenges will be the resistance zones at 105.00 and 105.57.
The 50-day and 200-day Moving Averages (MA) on the daily chart are also key indicators to watch. A break above these MAs could reinforce the bullish trend.
📉 Short-Term Trend:
On the 4H chart, the DXY is in a downtrend, with lower highs and lower lows. However, upcoming macroeconomic factors (the rate decision and Powell’s speech) could trigger a reversal or increased volatility.
Technical indicators like the RSI and MACD are in neutral territory, suggesting the market is awaiting clearer signals.
3. Trading Strategy Before and After the FOMC Decision
🔍 Before the Fed Announcement:
Caution is key. The market may experience mild fluctuations during the wait. Traders should avoid large positions and wait for clearer signals.
Closely monitor key support and resistance levels: 103.18 (support) and 105.00 (resistance).
🔥 After the Fed Announcement:
Scenario 1: Fed Holds Rates and Signals Hawkish Tone
The DXY could rally strongly, targeting resistance levels at 105.00 and 105.57.
Strategy: Look for buy opportunities when the DXY bounces off support or breaks above resistance.
Scenario 2: Fed Signals a Dovish Tone
The DXY could drop sharply, breaking below 103.18 and heading toward 102.50.
Strategy: Look for sell opportunities when the DXY breaks support or fails to surpass resistance.
Scenario 3: Fed Holds Rates Without Clear Signals
The DXY may continue to fluctuate within the 103.00 - 104.00 range.
Strategy: Trade within the range, using identified support and resistance levels.
4. Advice for Investors and Traders
📊 Risk management: Always set appropriate stop-loss and take-profit levels to protect your capital. Post-FOMC volatility can be intense, so prepare mentally and have a solid trading plan.
📰 Stay updated: Keep a close eye on Fed updates and market reactions. Jerome Powell’s speech could create significant trading opportunities.
🛠️ Use technical tools: Combine indicators like RSI, MACD, and Fibonacci to identify precise entry points.
5. Conclusion
Tonight’s FOMC meeting will be a decisive factor for the DXY’s short-term direction. With clear support and resistance levels identified, traders should prepare their strategies to capitalize on market movements.
🚨 Stay tuned for the latest updates on TradingView to ensure you don’t miss any trading opportunities!
Wishing you successful trades and profitable outcomes! 💪💰