renderwithme | Bank Nifty Prediction for July 14–18, 2025
~~ Bank Nifty Current StatusClosing Price (July 11, 2025): ~~
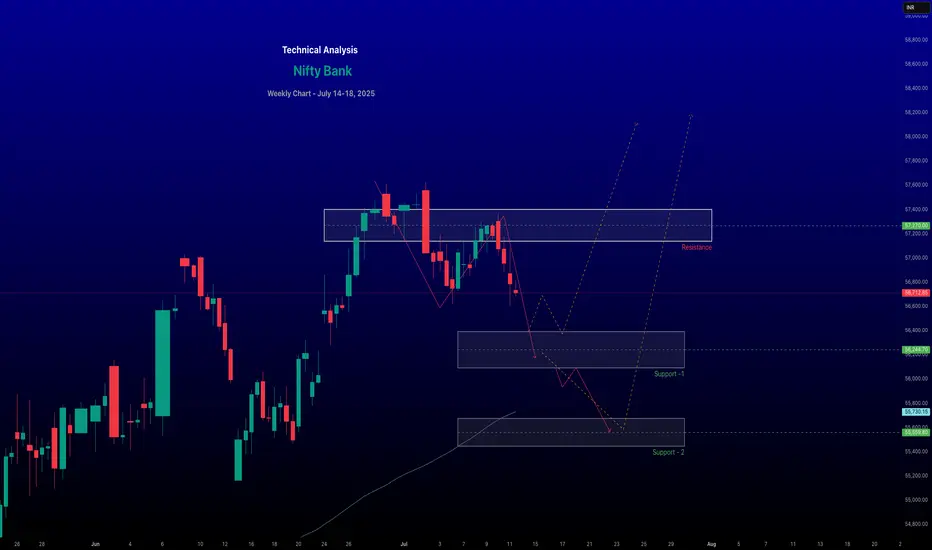
The Bank Nifty index closed at 56,754.7, down 0.35% (201.3 points), reflecting selling pressure in key constituents like HDFC Bank (-1.16%), Canara Bank (-0.64%), and Bank of Baroda (-0.79%).
#Recent Trend:
The index has shown a bearish tilt, breaching the 20-day Exponential Moving Average (EMA) support, with a cautious market sentiment.
# Historical Context:
Despite the recent dip, Bank Nifty has a positive seasonality trend, with 11 out of 17 years showing positive returns in July.
~~ Technical Analysis ~~
# Support Levels:
Immediate support: 56,400–56,000 (key psychological and technical level).
Additional supports: 55,736 and 55,438.
Critical support: 55,000, a level noted as a potential rebound point if held.
# Resistance Levels:
Immediate resistance: 57,000–57,500 (significant open interest in call options at these strikes).
Higher resistance: 57,300–57,500, with a breakout above 57,200 potentially signaling a move toward 57,600–58,000.
Bank Nifty Prediction for July 14–18, 2025Bullish Scenario:A breakout above 57,200–57,300 could push the index toward 57,600–58,000, especially if banking heavyweights like ICICI Bank or SBI show strength.
Sustained trading above 57,000, supported by positive earnings or global cues, could reinforce the bullish trend.
Bearish Scenario:A break below 56,500 could trigger selling toward 56,000 or lower (55,540–55,000).
Negative earnings or renewed global uncertainties (e.g., trade tensions) could exacerbate declines.
Likely Range: The index is expected to trade between 56,500–57,500, with consolidation likely unless a clear breakout or breakdown occurs.
~~ Disclaimer --
This analysis is based on recent technical data and market sentiment from web sources. It is for informational purposes only and not financial advice. Trading involves high risks, and past performance does not guarantee future results. Always conduct your own research or consult a SEBI-registered advisor before trading.
#Boost and comment will be highly appreciated
Community ideas
Metals can take a severe beatingNifty Metal Index CMP 9383
Elliott - when the 5th wave is bigger than the 3rd wave, expect a dramatic fall . Here the rally is over and a new set of three wave fall will begin.
Oscillators - both the oscillators are below their MA cross. This is a sign of danger
Fibs - the minimum tgt is back to the lows of the swing at 7800.
Trendline - since the minimum tgt is 7800 it will also break the trendline. Hence the longer term trend will come under question mark..
Conclusion - be extremely careful now on, with this sector
DCW (DCW Ltd)- Analysis Bullish Levels -if sustain above 86 (early entry risky) then 109 to 133 safe entry if sustain above this for 2 weeks) target can be around 189, 244, then 300 or 324 if sustain above for a week or two then we expect more upside and wait for targets around 570 to 626 small targets are marked on chart.
Bearish levels :- if sustain below 86 swing trade exit below this if sustains for 2-3 days then 54 to 47 good support with SL of 39 extrem level and very good support is around 22 below this more bearish.
**Consider some Points buffer in above levels
**Disclaimer -
I am not a SEBI registered analyst or advisor. I does not represent or endorse the accuracy or reliability of any information, conversation, or content. Stock trading is inherently risky and the users agree to assume complete and full responsibility for the outcomes of all trading decisions that they make, including but not limited to loss of capital. None of these communications should be construed as an offer to buy or sell securities, nor advice to do so. The users understands and acknowledges that there is a very high risk involved in trading securities. By using this information, the user agrees that use of this information is entirely at their own risk.
Thank you.
Fundamental Analysis – Gold Outlook - 14th to 20th JulyFundamental Drivers for the Week Ahead
U.S. CPI (Consumer Price Index) – July 16, 2025
A softer print will increase Fed rate-cut bets, boosting gold.
Fed Chair Powell’s Comments – July 18, 2025
Any dovish tilt can ignite safe-haven buying.
India's Rupee Trend & Monsoon Update
Weak rupee = higher MCX gold; strong rupee = some pressure.
Monsoon progress may also influence rural gold demand sentiment.
Gold Guinea - Short Term Bullish Challenges Resistance - ₹78,600The 2-hour chart of MCX Gold Guinea displays a strong recovery trend, with the current price at ₹78,472 and climbing steadily from the recent low near ₹77,000. The price has now retested a key horizontal resistance zone that previously triggered a major sell-off near the ₹78,500–₹78,600 range.
This recent rally has formed a clear higher low and higher high structure, indicating that bulls have regained short-term control. The breakout attempt from the previous consolidation zone has been followed by bullish candles with good body size and momentum, showing strong buying pressure. However, the latest candle shows a slight rejection wick at the top, indicating that sellers are defending the ₹78,600 zone.
If price sustains above ₹78,600, it could open the path toward ₹79,200 and ₹79,800, filling the gap left from the breakdown in late June. On the downside, ₹78,000–₹77,800 now becomes the first support zone. A failure to hold above this zone could lead to a pullback.
AFFLE India: Breakout Backed by Earnings📉Technical Overview
Post-COVID Surge: From INR 400 pre-COVID, AFL India climbed steadily, forming higher highs and higher lows.
Recent Breakout: Just two days ago, it exceeded its recent high and spiked to ₹2,080, now consolidating near ₹1,990.
Next Move: If it clears ₹2,080 and sustains above that level, targets are:
🎯Target 1: ₹2,200
🎯Target 2: ₹2,300
🎯Target 3: ₹2,400
Support Zones:
✅ Recent higher-low stop loss near ₹1,800
✅ If ₹1,800 fails, the next support lies between ₹1,330–₹1,400. A breakdown below this would invalidate the current bullish setup.
💰Q4 FY24 Financial Highlights (vs Q3 FY24 & Q4 FY23)
Total Income: ₹602 Cr (→ vs ₹602 Cr; ↑+19% vs ₹506 Cr)
Total Expenses: ₹468 Cr (↓–0.4% vs ₹470 Cr; ↑+9% vs ₹430 Cr)
Operating Profit: ₹134 Cr (↑+2% vs ₹131 Cr; ↑+37% vs ₹98 Cr)
Profit Before Tax: ₹124 Cr (→ vs ₹124 Cr; ↑+24% vs ₹100 Cr)
Profit After Tax: ₹103 Cr (↑+3% vs ₹100 Cr; ↑+18% vs ₹87 Cr)
Diluted EPS: ₹7.34 (↑+3% vs ₹7.13; ↑+18% vs ₹6.24)
✅ Strong YoY growth across key profitability metrics, especially operating and net profit—good sign of resilient operations.
🔍Fundamental Insights
Steady Margin Expansion: Operating margin expanded sequentially and year-over-year, indicating improving operational efficiency.
Healthy Balance Sheet: Company maintains a solid cash position with no significant debt—boosting financial flexibility.
Dividend History: Announced interim/final dividend (check exchange filings) reflecting steady shareholder returns.
Product & Market Position: Strong market presence in polyvinyl chloride (PVC) coatings and insulation materials, catering to growing infrastructure and auto sectors.
📝Conclusion
AFL India has demonstrated a classic breakout from a bullish price structure, supported by solid Q4 earnings. The stock now needs to clear and hold above ₹2,080 to confirm upside momentum. If successful, it may rally toward ₹2,400, keeping an eye on strict stop-loss near ₹1,800 or the ₹1,330–₹1,400 zone if support falters.
Disclaimer: lnkd.in
Ramco Cement Break Out Strong Is This the Start of a New Rally?📉Technical View:
Ramco Cement Limited has formed a beautiful ascending triangle pattern with a strong resistance zone at ₹1080–₹1130, tested since 2021. Today, it broke out and hit a new all-time high of ₹1152, now hovering around ₹1140.
If the breakout holds, we may see:
🎯Target 1: ₹1200
🎯Target 2: ₹1240
🎯Target 3: ₹1300
If the stock falls back below ₹1030, the breakout becomes invalid.
💰Q4 FY24 Financial Highlights (vs Q3 FY24 & Q4 FY23)
Total Income: ₹2397 Cr (↑+21% vs ₹1983 Cr; ↓–10% vs ₹2678 Cr)
Total Expenses: ₹2078 Cr (↑+93% vs ₹1074 Cr; ↓–8% vs ₹2259 Cr)
Operating Profits: ₹319 Cr (↑+14% vs ₹279 Cr; ↓–24% vs ₹419 Cr)
Profit Before Tax: ₹46 Cr (↓–76% vs ₹191 Cr; ↓–74% vs ₹175 Cr)
Profit After Tax: ₹26 Cr (↓–86% vs ₹182 Cr; ↓–80% vs ₹129 Cr)
Diluted EPS: ₹1.16 (↓–85% vs ₹7.72; ↓–79% vs ₹5.46)
🧾Despite strong revenue growth and higher operating profits sequentially, sharp cost escalations impacted margins in Q4.
📈Fundamentals & Dividend Insights:
✅ Company continues with capacity expansion in East & South India.
✅ Focus on green energy & cost optimization to improve margin outlook.
💸 Dividend Declared (May 2025): ₹3.50 per share
📝Conclusion:
The breakout on charts is significant and supported by top-line improvement. If sustained, the stock may offer strong upside potential, making Ramco Cement one to watch closely.
Disclaimer: lnkd.in
#Nifty Weekly Analysis 14-07-25 to 18-07-25#Nifty Weekly Analysis 14-07-25 to 18-07-25
25000-25070 is the PRZ area which will act as major support for next week.
25420-25500 is the resistance for next week.
Option sellers can sell the range from 25000-25500 for next week.
Plan a long from support with confirmation in price action.
Short level is ONLY below 24900.
View: Trend is upside in weekly/daily TFs. Check for bullish reversal in 15 mins from support.
XAUUSD - 1H SHORT (GOLD)FOREXCOM:XAUUSD
Hello traders , here is the full multi time frame analysis for this pair, let me know in the comment section below if you have any questions, the entry will be taken only if all rules of the strategies will be satisfied. wait for more Smart Money to develop before taking any position . I suggest you keep this pair on your watchlist and see if the rules of your strategy are satisfied...
Keep trading
Hustle hard
Markets can be Unpredictable, research before trading.
Disclaimer: This trade idea is based on Smart money concept and is for informational purposes only. Trading involves risks; seek professional advice before making any financial decisions. Informational only!!!
Gujarat Industries Power Bounces Back with Strength📈Technical Analysis
Breakout & Correction: After breaking ₹190 resistances in Jan 2024, GIPCL surged to ₹270 by June but later corrected sharply.
Strong Demand Base: ₹150 acted as a reliable bottom during the downturn, supporting a rebound into a higher-high, higher-low pattern.
Buy Trigger Zone: A breakout above ₹230–₹240 (former resistance) with bullish candlestick confirmation could unlock upward momentum toward:
🎯Target 1: ₹250
🎯Target 2: ₹260
🎯Target 3: ₹270
Support Levels:
🔻Recent higher-low stop-loss around ₹190
🔻₹150 remains the critical demand zone—below this, bullish case weakens
💰Q4 FY24 Financial Highlights (vs Q3 FY24 & Q4 FY23)
Total Income: ₹338 Cr (↑+5% vs ₹322 Cr; –9% vs ₹373 Cr)
Total Expenses: ₹219 Cr (↑+18% vs ₹196 Cr; –14% vs ₹254 Cr)
Operating Profits: ₹119 Cr (↑+34% vs ₹89 Cr; flat YoY)
Profit Before Tax: ₹86 Cr (↑+62% vs ₹53 Cr; ↑1% YoY)
Profit After Tax: ₹70 Cr (↑+79% vs ₹39 Cr; ↑6% YoY)
Diluted EPS: ₹4.49 (↑+73% vs ₹2.59; ↑2% vs ₹4.38)
📌 Sequential growth across the board—profit nearly doubled QoQ and edged higher YoY—signals improved margins and operational discipline.
🔍Fundamental Highlights
Dividend Yield ~1.9%: Company increased annual dividend to ₹4.09 per share (40.9%) for FY25
Consistent Dividend Growth: Yield rose steadily over the past decade, backed by a healthy ~29% payout ratio
Latest Q4 Net Profit: Up 5.4% QoQ to ₹70 Cr, reflecting resilience in earnings .
Strong Cash Flow & Balance Sheet: Installed capacity ~1,184 MW with healthy leverage metrics
🧭Conclusion
Gujarat Industries Power is showing promising signs—technically rebounding from ₹150 with strategic breakout levels at ₹230–₹240, and fundamental strengths in earnings growth and dividends. If the ₹230–₹240 zone is breached and confirmed, the stock could rally to ₹270.
Disclaimer: lnkd.in
#TIMETECHNOFundamentals:
* ROCE - 15.6%, ROE - 12.5%. Debt to Equity - 0.29
* EPS / Revenue - has been steadily increasing
* FIIs - Have increased stake this quarter from 6.69% to 7.64%
* Retail holding levels have gone down
* Promoter holding has remained steady
* Mutual Funds have increased stake
Technicals:
* Price is bouncing from a historical support zone which was earlier a resistance zone
* Only concern is that the bounce from support zone has been traditionally sharper than present bounce
* This warrants a cautious entry strategy with gradual exposure
* Tight entry can be taken considering candles are small and surfing the 10 / 20 DMA
* Weekly charts are not indicating anything significant
* Price is just below the 50% retracement and requires good volume to push through
* RS is strong / Momentum can pick up / ADR is 6.6% and increasing
I published this chart so that it can be kept in radar. At this point in time I don't think this is lining up for fast moves.
Note - Entry / SL / Target / Position size - Please figure out on your own based on risk appetite
Disclaimer - Your money requires your due diligence! I merely analyze and bring out probabilities. All the best.
#TIMETECHNOAsset: Time Technoplast Ltd (TIMETECHNO)
Breakout Level: 452
Potential Target: 525
Stop Loss: 430 (~6%)
Timeframe: Short to Medium term
Risk to Reward ratio : 1:3
Rationale:
Fundamentals -
Fundamentally decent stock with the following attributes:
* ROCE - 17.4%
* ROE - 14.2%
* Debt to Equity - 0.25
* Stock PE 25.7 / Industry PE - 26.6 || Stock PBV 3.45 / Industry PBV 2.97 - Company is slightly underpriced
* EPS / Revenue - Increasing over last 6 months
Technicals -
* Consolidating after a high volume up move
* Price is surfing the 10/20 DMA
* 200 DMA is forming a slightly increasing structure
* Multiple timeframe analysis - Not much to be gathered from monthly charts however weekly charts are showing consolidation as well
* RS is increasing
* ADR 3.1%
Market analysis
* Forecasted for ~31% further increase
* Promoter holding at 51% and remains steady
* FIIs/DIIs increasing holding / Not much MF activity
* Retail reducing
Cons
* Momentum is slow and ADR is low
This analysis is for educational purposes only and should not be considered as financial advice. Trading and investing in financial markets involve significant risk, and past performance is not indicative of future results. You should conduct your own research and consult with a qualified financial advisor before making any trading or investment decisions. The author is not responsible for any financial losses or damages that may result from the use of this information.
#MARKSANSAsset: Marksans Pharma Ltd (MARKSANS)
Breakout Level: 258
Potential Target: 290
Stop Loss: 244
Timeframe: Short to Medium term
Risk to Reward ratio : 1:2
Rationale:
Fundamentals -
Fundamentally decent stock with the following attributes:
* ROCE - 20.1%
* ROE - 16.8%
* Debt to Equity - 0.13
* Stock PE 30 / Industry PE - 33.4 || Stock PBV 4.63 / Industry PBV 3.76 - Company is underpriced
* EPS / Revenue - Increasing over last 6 months
Technicals -
* Overall structure - Forming a cup and handle structure and about to breach 200 DMA
* Multiple timeframe analysis - Stock poised for up move as the daily / weekly / monthly charts
* On daily charts, the price surged ~2% yesterday and volumes increased compared to last 2 days
* Increasing momentum / RS
* ADR 4.6%
Market analysis
* Forecasted for ~28% further increase
* Promoter holding at 43.87% and remains steady
* FIIs/DIIs/Mutual Funds increasing holding
* Retail reducing
* Good results
Cons
* Pharma stocks are always a gamble but no earnings to be released in near future
This analysis is for educational purposes only and should not be considered as financial advice. Trading and investing in financial markets involve significant risk, and past performance is not indicative of future results. You should conduct your own research and consult with a qualified financial advisor before making any trading or investment decisions. The author is not responsible for any financial losses or damages that may result from the use of this information.
NIFTY: BULL or BEAR? 12-JUL-2025Nifty keeps on falling after reaching the high of 25669.x.
Note: the support 25434 is already broken and moving more down. Is the market top out, can we see more down?
Everyone is blaming because of TRUMP tariff the market is falling. But this is healthy correction N technically valid. I expect the reversal soon in the coming days/weeks.
As of now Base supports are 25355/21734.
If it moves down more, we can see 24991/24777. But as per me this will be less probability.
I expect the market to TURN UP soon and expecting 27K (25955/26500/27K) first.
Normal targets: 27277-27900-2855
Ultimate targets: 30200-30755-32400.
NOTE: BELOW 24355 NIFTY WEAK and can show more down move before BIG REVERSAL.
MY VIEW: BUY ON DIPS.
NIFTY 50 Index - Bullish Setup Inside Rising ChannelDescription:
The NIFTY 50 is currently trading inside a well-defined ascending channel on the 4H chart. After a series of higher highs and higher lows, price action has now pulled back from the upper boundary of the channel and is approaching the lower trendline support.
Key observations:
The rising channel has been respected multiple times, confirming its validity.
Price is currently near the midline of the channel and could dip slightly lower toward the channel bottom (around 25,000 zone).
A bullish reversal is anticipated from the lower channel line, offering a high-probability long setup.
Resistance levels to watch: 25,355 and 25,549.
Strong support lies at 24,508, which is also a psychological level if the channel fails.
The idea is to wait for a bullish confirmation at the lower boundary and then ride the next potential leg upward toward the top of the channel.
Summary:
Bias: Bullish
Structure: Ascending Channel
Entry Zone: Near channel bottom (around 25,000)
Target: Top of channel (approx. 25,800+)
Invalidation: Breakdown below 24,508
#MARKSANSAsset: Marksans Pharma Ltd (MARKSANS)
Breakout Level: 266
Potential Target: 325
Stop Loss: 248
Timeframe: Short to Medium term
Risk to Reward ratio : 1:3
Rationale:
Fundamentals -
Fundamentally decent stock with the following attributes:
* ROCE - 20.1%
* ROE - 16.8%
* Debt to Equity - 0.13
* Stock PE 30.3 / Industry PE - 33.5 || Stock PBV 4.68 / Industry PBV 3.42 - Company is slightly overpriced
* EPS / Revenue - Increasing over last 6 months
Technicals -
* Overall structure - Forming a VCP about to breach 200 DMA
* Multiple timeframe analysis - Stock poised for up move as the daily / weekly / monthly charts
* Increasing momentum / RS
* ADR 3.4%
Market analysis
* Forecasted for ~27% further increase
* Promoter holding at 43.87% and remains steady
* FIIs/DIIs/Mutual Funds increasing holding
* Retail reducing
* Good results
Cons
* Pharma stocks are always a gamble but no earnings to be released in near future
This analysis is for educational purposes only and should not be considered as financial advice. Trading and investing in financial markets involve significant risk, and past performance is not indicative of future results. You should conduct your own research and consult with a qualified financial advisor before making any trading or investment decisions. The author is not responsible for any financial losses or damages that may result from the use of this information.
BTCUSD DAILY GANN PRICE AND TIME ANALYSIS 12 JULY 2025BTCUSD daily chart analysis shows a price and time happening at price of 123943 on 06 Aug 2025. Earlier important price was 105351 where we got resistance till 04 Feb 2025. We got correction till 74366 till 06 April 2025. We got a higher low on 06 may 2025 at important price level of 92957. We will watch both price of 123943 and date of 06 Aug 2025.
Happy Trading !!!
#PENINDAsset: Pennar Industries Ltd (PENIND)
Entry Level: 233
Potential Target: 300 (1st target)
Stop Loss: 221 (~4.5% risk)
Timeframe: Short to Medium term
Risk to Reward ratio : 1:2
Rationale:
Fundamentals -
Fundamentally decent stock with the following attributes:
* ROCE - 16.0%
* ROE - 12.7%
* Debt to Equity - 0.81
* Stock PE 26 / Industry PE - 37.4 || Stock PBV 3.11 / Industry PBV 4.21 - Company is underpriced
* EPS / Revenue - Has been increasing for the last 6 months
* ADR is 3.7%
Technical -
* Overall structure - Structure seems to be forming a cup after a breakout from an earlier cup structure, 10 DMA is crossing above the 20 DMA
* Relative Strength is picking up.
* Multiple timeframe analysis - Weekly structure is forming a penant structure
Market analysis
* Promoter holding has gone up.
* Holding pattern - FIIs increased significantly / DIIs have added / Promoter holding steady / Retail reducing
Cons
* Momentum and ADR is low indicating slow movement potential
This analysis is for educational purposes only and should not be considered as financial advice. Trading and investing in financial markets involve significant risk, and past performance is not indicative of future results. You should conduct your own research and consult with a qualified financial advisor before making any trading or investment decisions. The author is not responsible for any financial losses or damages that may result from the use of this information.
Bitcoin (BTCUSDT) Breaks New ATH at $118K | What’s Next? Altseas🎉 Congratulations to all crypto enthusiasts — Bitcoin has officially printed a new all-time high at $118,000!
🔍 Now What?
On the right side of the chart, you can see Bitcoin's daily structure. If you’ve been following along, you’ll recall that BTC was trading within a descending channel. But now, we've decisively broken through the upper boundary of that channel, which is a bullish signal.
📌 Based on classic technical analysis, when a descending channel breaks upward, the next target is often the opposite side of the origin point — meaning BTC has potential to push toward $130,000 in the coming weeks.
🚨 Caution: Don’t Fall for FOMO
The market is clearly in a hype-driven phase, and while there are plenty of opportunities for new entries, especially in altcoins, risk management is key.
💡 Here's what you should do:
Avoid chasing pumps blindly.
Position sizing matters more than ever.
Stay alert, but don't be afraid to take small calculated long positions.
📈 Smarter Long Entries on Lower Timeframes
Watch for small consolidations or a retest near the daily breakout candle. On the 4H and 1H timeframes, clean setups will form that allow you to enter long positions with tighter stops.
Everything is now clearly bullish. Momentum is in favor of buyers.
📊 BTC Dominance (BTC.D) Breakdown = Altcoin Signal
On the right side of the second chart, we’re monitoring BTC Dominance (BTC.D) — which has been dropping while BTC continues to climb. This is a very bullish sign for altcoins.
🔁 What we want to see now:
BTC.D starts to range or correct slightly.
Ideally, this would happen while BTCUSDT stabilizes or continues its rally.
This scenario could trigger an altcoin rally, or potentially a full-on altseason.
✅ Final Thought
Momentum is clearly with the bulls. BTC has broken into price discovery, and altcoins are waking up. Don’t fear the market, but control your risk and look for smart entries — the altseason may have just begun.
#Bitcoin #BTCUSDT #CryptoAnalysis #ATH #Altseason #Altcoins #TechnicalAnalysis #BTCdominance #BreakoutTrading #CryptoMarket #CryptoStrategy #PriceDiscovery #RiskManagement