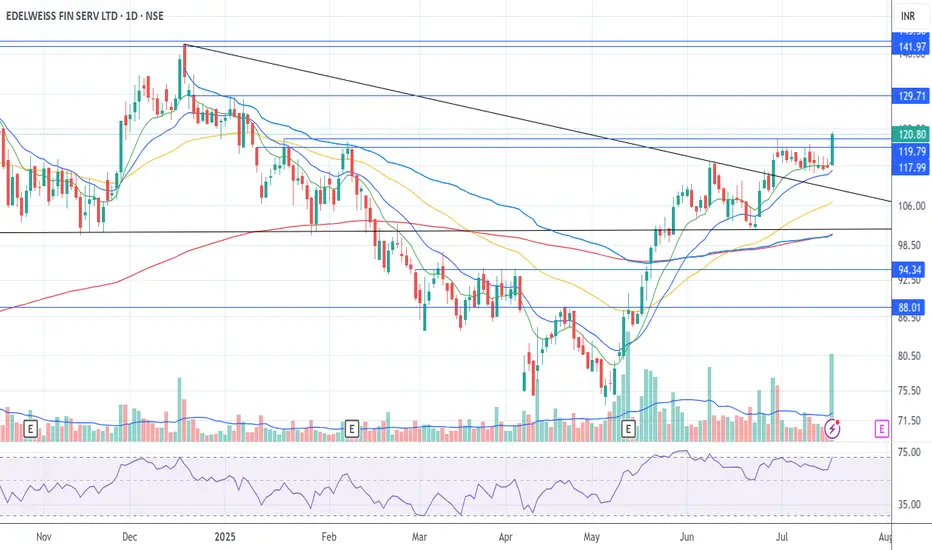
EDELWEISS FIN SERVE LTD - BUY/LONG TRADEThere is bullish head and shoulder formation on edelweiss fin serve ltd. given breakout on daily time frame with supporting volume . one can look to buy if next candle hold above breakout candle high with mention target and without stoploss as i will update when to exit.
Community ideas
NIPPONIND : is correction over on Wave 2 or B?INDO-NATIONAL LTD (NSE: NIPPONIND) 🚀
Weekly Chart Analysis – Potential Swing Opportunity!
1. Structure & Setup
The stock has completed a major correction in the zone of 50%-78.6% Fibonacci retracement of Wave A (408.80–458.50).
Wave B or 2 seems to be in place, setting up for a potential bullish move.
Previous resistance and correction occurred from the extended retracement zone (113%-127% fib).
2. Key Levels & Targets
First Swing Target: 50% fib retracement of Wave B or 2 at ₹574.90–625.00 🥇
Second Swing Target: 78.6% fib retracement of Wave B or 2 at ₹761.40 🥈
Support: 78.6% fib retracement of Wave A at ₹408.80
3. Risk Management
STOP LOSS: On weekly or daily close below the correction zone (failing Wave B or 2), i.e., below ₹408.80 🚨
4. Observations & Strategy
1️⃣ Chances of a bullish reversal are high from the current zone, supported by fib retracement confluence.
2️⃣ Watch for a breakout above ₹500 for confirmation of momentum.
3️⃣ Risk/Reward is favorable for positional swing traders.
Summary:
A strong setup for a multi-month swing! Monitor price action near support and trail your stop as the move unfolds. 📈
Like & Follow for more setups! 👍✨
#NIPPONIND #SwingTrade #TechnicalAnalysis #Fibonacci #TradingView #Stocks #NSE
NIFTY Levels for TodayHere are the today's NIFTY Levels for intraday (in the image below). Based on market movement, these levels can act as support, resistance or both.
Please consider these levels only if there is movement in index and 15m candle sustains at the given levels. The SL (Stop loss) for each BUY trade should be the previous RED candle below the given level. Similarly, the SL (Stop loss) for each SELL trade should be the previous GREEN candle above the given level.
Note: This idea and these levels are only for learning and educational purpose.
Your likes /boosts gives us motivation for continued learning and support.
BANKNIFTY Levels for Today
Here are the today's BANKNIFTY Levels for intraday (in the image below). Based on market movement, these levels can act as support, resistance or both.
Please consider these levels only if there is movement in index and 15m candle sustains at the given levels. The SL (Stop loss) for each BUY trade should be the previous RED candle below the given level. Similarly, the SL (Stop loss) for each SELL trade should be the previous GREEN candle above the given level.
Note: This idea and these levels are only for learning and educational purpose.
Your likes and boosts gives us motivation for continued learning and support.
ONMOBILE (Onmobile Global Ltd)- Analysis Bullish Levels -if sustain above 52 to 56 (early entry risky) then 65 to 69 safe entry if sustain above this for 2 weeks) target can be around 88 then 108 then 125 to 128 then 142 to 148 if sustain above for a week or two then we expect more upside
Bearish levels :- if sustain below 49 to 45 swing trade exit below this if sustains for 2-3 days then 36 good support with SL of 32 below this more bearish.
**Consider some Points buffer in above levels
**Disclaimer -
I am not a SEBI registered analyst or advisor. I does not represent or endorse the accuracy or reliability of any information, conversation, or content. Stock trading is inherently risky and the users agree to assume complete and full responsibility for the outcomes of all trading decisions that they make, including but not limited to loss of capital. None of these communications should be construed as an offer to buy or sell securities, nor advice to do so. The users understands and acknowledges that there is a very high risk involved in trading securities. By using this information, the user agrees that use of this information is entirely at their own risk.
Thank you.
Nifty call for 17-08-2025Nifty may open with slight positive note i.e 40 points on upside around 25260 as per SGX NIFTY. Classical doji formed in yesterday trading session which is indicating current uptrend may halt for some period of time until upto break 25500 levels which has posted recently. Tech Mahindra posted above estimated earnings with good numbers compared with other IT companies after market hours it is boosted for stock so investors add this stock to their portfolios for short term at current levels.
Support levels : 25180,25120
Resistance levels : 25256,25320
Disclimer : I AM NOT A SEBI RESEARCH ANALYST OR FINANCIAL ADVISOR, these recommendations are only for education purpose, not for trading and investment purpose please take an advise from your financial advisor before investing on my recommendations.
🙏 : If you liked my content please suggest to your friends follow my trading channel. Your likes and comments provide boosting to me to update more financial information.
Thanking you
NIFTY : Trading plan and levels for 17-July-2025📊 NIFTY INTRADAY TRADING PLAN – 17-Jul-2025
200+ Points Gap Opening Considered Significant | Educational Structured Trading Plan
📍 KEY ZONES & LEVELS TO MONITOR
🟥 Opening Resistance Zone: 25,376 – 25,340
🔴 Last Intraday Resistance: 25,430
🟧 Opening Support Zone: 25,083 – 25,102
🟩 Last Intraday Support Zone: 24,932 – 24,970
🚀 SCENARIO 1: GAP-UP OPENING (Above 25,376) 📈
If NIFTY opens above 25,376 with 100+ points gap-up, expect buyers to dominate initially, pushing towards 25,430 (Last Intraday Resistance) .
Avoid aggressive longs exactly at the open. Let the first 15-minute candle settle to confirm strength.
If price sustains above 25,430 with volume, look for further upside, but be mindful of exhaustion near round numbers.
Options Tip: Prefer ATM Call Options with tight stop-loss or Bull Call Spread to manage risk better.
📊 SCENARIO 2: FLAT OPENING (Between 25,102 – 25,376) ⚖️
This range marks the consolidation area between Opening Support and Opening Resistance Zone .
Price behavior here is crucial for intraday direction bias.
If price holds above 25,224.40 post-open, bias is slightly bullish towards the Resistance Zone.
If price breaks below 25,102 , sellers may drag it towards Last Intraday Support 24,932 – 24,970 .
Options Tip: Consider Iron Fly or Strangle setups if premiums are attractive. Be patient for breakouts.
📉 SCENARIO 3: GAP-DOWN OPENING (Below 25,083) ⚠️
If NIFTY opens below 25,083 with 100+ points gap-down, expect weakness to persist.
Primary downside target becomes Last Intraday Support Zone: 24,932 – 24,970 .
Sell-on-rise strategy is preferred after 15-minute candle confirmation below 25,083 .
Options Tip: Focus on ATM or ITM Put Options or use Bear Put Spreads for safer execution.
💡 RISK MANAGEMENT TIPS FOR OPTIONS TRADERS
📏 Always risk only 1–2% of total capital per trade.
⏳ Avoid trades during the first 15–30 minutes to let volatility settle.
🔐 Respect Hourly Candle Close stops rather than reacting to wicks.
⚖️ Prefer Spreads and Hedged Strategies in highly volatile or uncertain conditions.
🚫 Avoid over-leveraging especially in expiry week or event-heavy days.
📌 SUMMARY & CONCLUSION
Bullish Bias: Gap-up above 25,376 → Target 25,430
Neutral Range: Between 25,102 – 25,376 → Wait for breakout confirmation
Bearish Bias: Gap-down below 25,083 → Target 24,932 – 24,970
Trade with a calm mindset, respecting the levels and waiting for candle confirmations to reduce false entries.
⚠️ DISCLAIMER: I am not a SEBI-registered analyst. This plan is purely for educational and informational purposes. Always consult your financial advisor before making any investment decisions.
BANKNIFTY : Intraday Trading levels and Plan for 17-July-2025📊 BANK NIFTY INTRADAY TRADING PLAN – 17-Jul-2025
200+ Points Gap Opening Considered Significant | Structured by Psychological Zones
📍 KEY ZONES AND LEVELS TO MONITOR:
🟥 Opening Resistance Zone: 57,395 – 57,513
🔴 Profit Booking Resistance: 57,881
🟧 NO TRADE ZONE: 56,934 – 57,104
🟦 Opening Support: 56,934
🟩 Last Intraday Support: 56,740
🟩 Buyer’s Support Zone: 56,160 – 56,265
🚀 SCENARIO 1: GAP-UP OPENING (Above 57,395) 📈
If BANK NIFTY opens above 57,395 with 200+ points gap-up, the market enters the Opening Resistance Zone (57,395 – 57,513) .
Buyers should be cautious within this zone, focusing only on quick momentum scalps until a 15-minute candle closes above 57,513 .
If 57,513 breaks and sustains, the next target would be 57,881 (Profit Booking Resistance) .
Options Tip: Deploy ATM Call Options with small quantity initially, increase exposure only on candle confirmation. Avoid far OTM calls in strong gap-ups.
📊 SCENARIO 2: FLAT OPENING (Between 56,934 – 57,104) ⚖️
This zone is marked as NO TRADE ZONE on the chart. Prices may behave indecisively here, so patience is key.
If BANK NIFTY sustains above 57,104 after opening flat, expect upside continuation toward the Opening Resistance Zone.
If BANK NIFTY breaks below 56,934 , look for weakness targeting Last Intraday Support 56,740 .
Options Tip: Consider Iron Condor or Strangle Writing setups within this NO TRADE ZONE if volatility is high. Otherwise, wait for breakout confirmation.
📉 SCENARIO 3: GAP-DOWN OPENING (Below 56,740) ⚠️
If BANK NIFTY opens below 56,740 with a significant gap, bearish momentum is confirmed.
The immediate downside target would be the Buyer’s Support Zone: 56,160 – 56,265 .
Sell-on-rise strategy can be considered after the first 15-minute candle closes below 56,740 .
Options Tip: Prefer ATM or ITM Put Options or build Bear Put Spreads for controlled risk-reward. Avoid naked shorts in case of sudden reversal.
💡 RISK MANAGEMENT TIPS FOR OPTIONS TRADERS
📏 Risk only 1–2% of capital per trade.
⏳ Avoid aggressive entries in the first 15–30 minutes ; let price settle.
🔐 Use Hourly Candle Close for major decision stops, not just wick-based SL.
⚖️ Consider Hedged Strategies (like spreads) during volatile conditions.
📅 Avoid trading just before major news events or expiry if possible.
📌 SUMMARY & CONCLUSION
Bullish Scenario: Gap-up above 57,395 → Target 57,881
Neutral Scenario: Flat between 56,934 – 57,104 → Wait for breakout confirmation
Bearish Scenario: Gap-down below 56,740 → Target 56,160 – 56,265
Trade cautiously around marked zones and follow structured rules. Consistency over prediction!
⚠️ DISCLAIMER: I am not a SEBI-registered analyst. This plan is shared for educational and informational purposes only. Please consult your financial advisor before making any investment decisions.
Nifty 50 - Symmetrical Triangle Breakout WatchNifty is currently consolidating within a symmetrical triangle pattern on the 1-hour chart. Price is respecting both the rising support and descending resistance trendlines.
Key observations:
Clear higher lows indicate underlying bullish pressure.
Lower highs show selling pressure near resistance.
Expecting a possible pullback toward the lower trendline before a potential breakout to the upside.
Trade Plan (if breakout occurs):
📈 Bullish breakout above the upper trendline could lead to a sharp rally.
✅ Confirmation needed with strong volume and candle close above resistance.
Invalid if price breaks below the support trendline.
Stay alert for a breakout or breakdown — both scenarios possible, but current structure slightly favors bulls.
BTCUSDT – Breakout confirmed, bullish momentum continuesBTCUSDT has officially broken above a long-standing resistance channel, confirming a breakout and establishing a base around the nearest Fair Value Gap. The price action maintains a clear uptrend structure with consecutive higher lows and higher highs, supported by consistent buying pressure after minor pullbacks.
In terms of news, the U.S. decision to temporarily delay stricter regulations on spot Bitcoin ETFs, along with stable interest rate signals from the Fed, has boosted market sentiment. Capital continues to flow into crypto, especially as altcoins show limited recovery, making BTC the preferred asset.
As long as BTCUSDT holds above the nearest support zone, the pair is likely to advance toward the next psychological resistance. Any pullbacks could offer a buy-on-dip opportunity in line with the current trend.
GOLD tug-of-war between buyers and sellers near key levelsCurrently, the price hovers near ₹78,489, slightly below the ₹78,800 resistance. If bulls can decisively break above ₹78,800 and hold, the next resistance targets are clearly demarcated at:
₹79,500 — minor resistance and previous support-turned-resistance.
₹80,000 — psychological round level and a previous top.
Failure to break ₹78,800 again may trigger a minor pullback to the ₹77,800 support zone, which has held well multiple times in the past few sessions.
The recent formation of higher lows and higher highs signals a short-term bullish structure.
Traders may look for a breakout and retest of ₹78,800 for fresh longs with targets near ₹79,500 and ₹80,000. On the downside, ₹77,800 remains key support to watch.
EUR/USD Slumps – Shakeout or New Sell-Off?The euro took a sharp nosedive, falling from 1.168 to nearly 1.160 in its steepest drop of the week, after hotter-than-expected U.S. CPI data shocked the market. This move reflects a classic repricing of rate expectations, as traders quickly rotated back into the dollar – the “sleeping giant” now seemingly reawakened.
Is this just a technical pullback or the beginning of deeper pain for EUR/USD bulls? With the Fed signaling it may hike again if inflation persists, the macro bias clearly favors USD strength. However, if the 1.160 support holds and we see a strong bounce with rising volume, a short squeeze could be in the making – catching late bears off guard.
Gold Tumbles After CPI Shock – July’s Best Buying Opportunity?Gold saw a sharp sell-off after U.S. CPI data came in hotter than expected, plunging nearly $40 to $3,327/oz in just a few hours. While this aggressive move sparked fears of a breakdown, price is now holding firm above a major H4 Fair Value Gap – a key support zone that has triggered multiple reversals in the past.
If buyers manage to defend this level, a swift rebound toward $3,375–$3,400 could be in play – especially as the dollar shows signs of cooling off after its CPI-fueled rally. However, should $3,320 give way, a deeper correction toward $3,280 becomes highly probable – and that’s when true panic may begin.
EUR/USD Under Pressure: Will the Downtrend Continue?The EUR/USD exchange rate remains under pressure today, fluctuating below the 1.1700 level as the U.S. dollar gains strength following President Trump's announcement of new tariff letters directed at his two largest trade partners, boosting demand for safe-haven assets.
The downtrend may be further reinforced in the near term, if not in the short run. On the chart, a wedge pattern is forming, and breaking this pattern could add fresh momentum to EUR/USD.
Do you agree with my view?
Leave your comments below and don’t forget to like the post for extra luck!
BTC/USD Pullback: What’s Next for Bitcoin?Hello, passionate and wealthy traders! What are your thoughts on BTC/USD?
After a strong surge above the 122,500 USD zone, BTC/USD has started to experience a slight pullback. This is completely normal and necessary for Bitcoin to gain new momentum.
In my personal view, the recent peak of BTC/USD signals that this correction is in play. But where do you think BTC/USD will adjust to? Personally, I believe the 111,500 USD zone is quite reasonable. It’s also the previous breakout level, and this pullback aims to test the uptrend safely.
What about you? Where do you see BTC/USD heading? Looking forward to hearing your thoughts!
Nifty Trading Strategy for 17th July 2025📈 NIFTY INTRADAY STRATEGY – 15 MIN CANDLE BREAKOUT 📉
(Short-Term Positional | Confirmation-Based Entry)
🔹 BUY SETUP – Go Long
📌 Entry Condition:
✅ Buy above the high of the 15-minute candle that closes above 25,256
🎯 Targets:
🎯 Target 1: 25,280
🎯 Target 2: 25,320
🎯 Target 3: 25,350
🛡️ Stop Loss: Place below the low of the breakout candle
🧠 Pro Tip:
Wait for a full 15-minute candle close above 25,256 before entering. No early entries — let the breakout confirm.
🔻 SELL SETUP – Go Short
📌 Entry Condition:
❌ Sell below the low of the 15-minute candle that closes below 25,095
🎯 Targets:
🎯 Target 1: 25,070
🎯 Target 2: 25,040
🎯 Target 3: 25,010
🛡️ Stop Loss: Place above the high of the breakdown candle
🧠 Pro Tip:
Don’t get trapped by wicks. Always confirm the close below 25,095 on the 15-min chart before placing your trade.
⚠️ DISCLAIMER
📌 I am not a SEBI-registered advisor.
📉 This strategy is shared for educational and informational purposes only.
💼 Trading and investing in financial markets involve risk. You are solely responsible for your decisions.
📊 Please do your own research or consult with a certified financial advisor before taking any position.
Gold Trading Strategy for 17th July 2025📈 GOLD ($) INTRADAY STRATEGY ALERT 📉
(1-Hour Candle Confirmation Based Entry)
🔹 BUY Setup – Long Trade
📌 Entry Condition:
👉 Buy above the high of the 1-hour candle that closes above $3364
🎯 Targets:
🎯 Target 1: $3375
🎯 Target 2: $3386
🎯 Target 3: $3397
🛡️ Stop Loss: Just below the low of the breakout candle
🧠 Pro Tip: Let the candle close above $3364. Don't jump in early — confirmation is key.
🔻 SELL Setup – Short Trade
📌 Entry Condition:
👉 Sell below the low of the 1-hour candle that closes below $3330
🎯 Targets:
🎯 Target 1: $3319
🎯 Target 2: $3308
🎯 Target 3: $3297
🛡️ Stop Loss: Just above the high of the breakdown candle
🧠 Pro Tip: Wait for a proper close below $3330 before entering short.
⚠️ DISCLAIMER
📢 This content is for educational and informational purposes only.
📉 Trading in financial markets involves substantial risk. You could lose capital.
📊 Please consult your financial advisor or do your own analysis before making trading decisions.
PATANJALI - OPTIONS TRADE SETUPPATANJALI OPTIONS TRADE SETUP – 17 JULY
Spot: ₹1859.6
Trend: Bullish
Volatility: Moderate IV rise (38–41%)
Lot Size: 300
________________________________________
1. Bullish Trade (Naked options as per trend)
Best CE: Buy 1860 CE @ ₹59.45
Why: Strong continuation signal with rising OI and price, heavy volume, and ideal gamma/vega mix for price moves.
________________________________________
2. Contrarian Trade (Naked options against trend)
Best PE: Buy 1800 PE @ ₹31.3
Why: Defensive Put play with unusually high activity and rising IV → could work as hedge if breakdown begins below ₹1840.
________________________________________
3. Strategy Trade (As per trend + OI data)
Strategy: Bull Call Spread → Buy 1860 CE / Sell 1920 CE
Net Debit: ₹59.45 - ₹35.5 = ₹23.95
Max Profit: ₹60 - ₹23.95 = ₹36.05
Max Loss: ₹23.95
Risk:Reward ≈ 1:1.5
Lot Size: 300
Total Risk: ₹7,185
Max Profit: ₹10,815
Why:
• Massive Long Buildup in CE chain (1820 to 1960), with 1860 CE leading in volume and OI surge
• 1860–1920 spread captures ideal move zone before resistance at 1960
• IVs rising moderately → favors debit spread entry
• PE chain showing Short Buildup, especially at 1800/1840/1880 → downside bets getting squeezed
• Balanced risk with great R:R (1:1.5) near breakout zone — clean bullish continuation setup
________________________________________
📘 My Trading Setup Rules
Avoid Gap Plays
→ Check pre-open price action to avoid trades influenced by gap-ups/gap-downs.
Breakout Entry Only
→ Enter trades only if price breaks previous day’s High (for bullish trades) or Low (for bearish trades).
Watch Volume for Confirmation
→ Monitor volume closely. No volume = No trade.
Enter on Strong Candle + Volume
→ Execute the trade only if a strong candle appears with increasing volume in the direction of the trade.
Defined Risk:Reward Only
→ Take trades only if R:R is favorable (ideally ≥ 1:2).
Premium Disclaimer
→ Option premiums shown are based on EOD prices — real-time premiums may vary during execution.
Time Frame Preference
→ Trade with your preferred time frame — this strategy works across intraday or positional setups.
________________________________________
⚠ Disclaimer (Please Read):
• These Trades are shared for educational purposes only and is not investment advice.
• I am not a SEBI-registered advisor.
• The information provided here is based on personal market observation.
• No buy/sell recommendations are being made.
• Please do your own research or consult a registered financial advisor before making any trading decisions.
• Trading involves risk. Always use proper risk management.
I am not responsible for trading decisions based on this post.
________________________________________
DLF Ltd | Breakout Setup with Hourly Support | CMP ₹845📌 Technical Analysis Overview:
✅ Breakout Setup: Price is breaking out of a Daily Resistance zone around ₹848.
🟩 Hourly Support: Key support identified at ₹832. Price has consistently bounced from this level.
📈 RSI Momentum: RSI > 65 shows strong short-term bullish momentum.
🔍 Price Action Context:
=================================
Recent consolidation below daily resistance.
A sharp move followed by a tight range indicates accumulation.
Sustained break above ₹848 could lead to price discovery.
🔎 Chart Highlights:
🔹 Daily Resistance: ₹848
🔹 Hourly Support: ₹832
🔹 Price Action Target: ₹884
📊 Volume surge can confirm breakout.
⚠️ Disclaimer:
This chart is shared for educational and informational purposes only. It is not investment advice. Always perform your own due diligence and consult a SEBI-registered advisor before taking any position. Trading involves risk.
PCBL Chemical LtdPCBL is nearing a breakout zone in a tightening triangle pattern and is making higher lows and lower highs. The stock is trading above the short-term EMA, which is a positive signal.
Buy on breakout above 437, with the target of 465, 485 and 500 (if momentum continues)
Stop loss: set below 410