MASK 3.7x PUMP — Is a BIG DIP Coming?MASK 3.7x PUMP — Is a BIG DIP Coming?
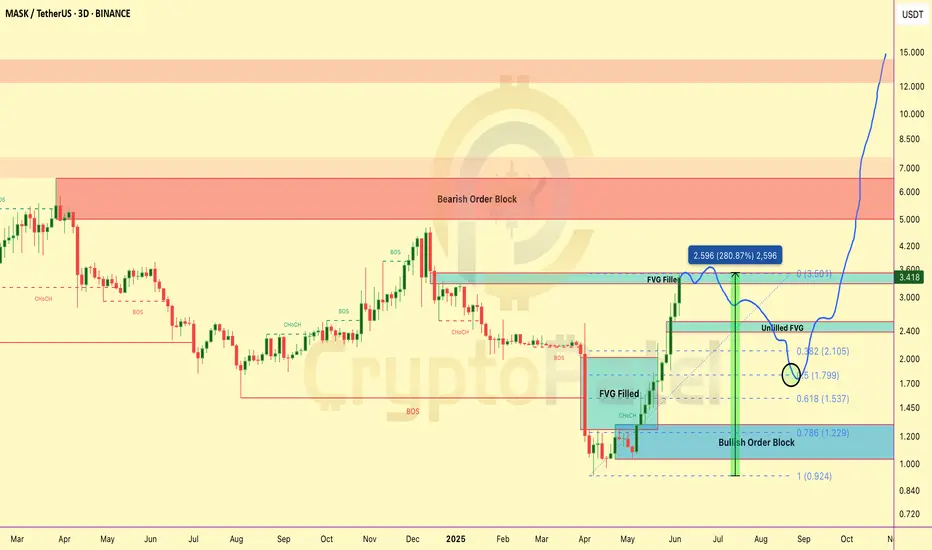
MASK just delivered a MASSIVE rally from the Bullish Order Block at $1.2–$1.3 — and filled the FVG around $3.5.
Here’s what’s next 👇
🟢 Short-Term Outlook:
👉 After pumping from $0.927 → $3.50 → that’s a 3.7x move WITHOUT any major retracement.
👉 High chances of a healthy pullback next.
👉 Strong Accumulation Zone: If price drops towards 0.5 Fib retracement at $1.80 → This will be a key area for Smart Money to re-enter.
🟢 Mid-Term Potential:
👉 Once accumulation is done → breakout above $3.5 highly likely.
👉 First big target → Bearish Order Block at $5–$7.
🟢 Long-Term Vision:
👉 If BTC supports and MASK maintains bullish structure → can aim for $15/$30/$50 🚀
👉 Huge upside still left on higher timeframes.
Key Levels to Watch:
✅ $3.5 → Resistance
✅ $2.1–$1.5 → Retracement buy zone (Unfilled FVG + Fib confluence)
✅ $1.80 → 0.5 Fib — Strong Accumulation Zone
✅ $5–$7 → Major target zone
✅ $15/$30/$50 → Long-term moonshot
My Play → Waiting patiently for retracement → looking to accumulate in $2.1–$1.5 zone, ideally around $1.80 → position for next rally!
👉 What’s YOUR strategy on MASK? Buying the dip or waiting higher? Comment below 👇👇👇
NFA & DYOR
Harmonic Patterns
Bitcoin Bulls vs Bears — Battle Zones Mapped Out#Bitcoin Bulls vs Bears — Battle Zones Mapped Out
🔰 $105K–$106.7K = Bearish Order Block:
Below this zone = CRYPTOCAP:BTC stays bearish unless HTF closes above $106.7K
🔰 Next Moves:
▪️ Likely retest $105K–$106K before next leg ↓
▪️ Target: $97K–$95K zone
🔰 Key Levels:
✅ Holding 0.618 Fib (support)
✅ Unfilled FVG: $97K–$98.3K
✅ Bullish OBs: $95.7K–$97K | $93.5K–$94.7K
If $97,000 holds strong → Expect BIG bounce!
BEL (Bharat Electronics Ltd)- AnalysisBullish Levels -if sustain above 298 (early entry risky) then 336 (safe entry if sustain above this for a week) first target can be around 380 if sustain above this for a week or two then we can expect targets around 456 then the last stop for now would be around 622
Bearish levels :- if sustain below 274 then 255 mild support then 203 good support if come around this price best for averaging or new entry with SL of 184 if day closing below this for 2-3 days for Long term Investor below this more bearish.
**Consider some Points buffer in above levels
**Disclaimer -
I am not a SEBI registered analyst or advisor. I does not represent or endorse the accuracy or reliability of any information, conversation, or content. Stock trading is inherently risky and the users agree to assume complete and full responsibility for the outcomes of all trading decisions that they make, including but not limited to loss of capital. None of these communications should be construed as an offer to buy or sell securities, nor advice to do so. The users understands and acknowledges that there is a very high risk involved in trading securities. By using this information, the user agrees that use of this information is entirely at their own risk.
Thank you.
Asian Paints View For 52 Weeks
---
## 🎨 **Asian Paints Ltd – Business Model Overview**
**Asian Paints Ltd** is India’s largest and one of Asia’s leading paint companies. Founded in 1942, it has evolved from a decorative paint manufacturer into a **full home décor solutions provider**, with a strong supply chain, brand loyalty, and diversified offerings.
---
### 1. **Business Type**
**B2C and B2B Manufacturer & Retailer**
* **B2C**: Paints, waterproofing, home décor, furnishings.
* **B2B**: Industrial coatings, protective paints, automotive coatings, and OEM partnerships.
---
### 2. **Core Offerings**
| Segment | Products/Services |
| --------------------------- | -------------------------------------------------------------------------------- |
| 🎨 **Decorative Paints** | Interior & exterior paints, textures, waterproofing, primers, enamels |
| 🏭 **Industrial Coatings** | Automotive paints, powder coatings, marine & protective coatings |
| 🏠 **Home Décor Solutions** | Kitchen, bath fittings, lighting, furniture via brands like *Sleek* and *EssEss* |
| 📦 **Tools & Services** | Painting tools, Color Consultancy, *Beautiful Homes* services |
---
### 3. **Revenue Streams**
| Source | Description |
| ------------------------------- | ----------------------------------------------------------------- |
| 🎨 **Paint Product Sales** | Revenue from decorative & industrial paints (largest contributor) |
| 🛠️ **Home Décor Services** | Interior design, furniture, and modular kitchen services |
| 🧪 **Waterproofing Solutions** | A key growth area via its SmartCare range |
| 📢 **Dealer Network Promotion** | Indirect monetization via dealer loyalty and repaint cycles |
| 🔧 **Projects & Contracts** | Institutional and government painting contracts |
---
### 4. **Target Customer Segments**
* **Retail Consumers** (homeowners, tenants)
* **Contractors and Painters**
* **Architects and Interior Designers**
* **Builders and Real Estate Developers**
* **Automotive and Industrial Clients**
---
### 5. **Key Strengths / Competitive Advantages**
✅ Market Leadership in India (\~50% share)
✅ Massive dealer network (over 70,000 dealers)
✅ In-house R\&D with innovation in eco-friendly, long-lasting paints
✅ Strong **brand recall** and extensive **logistics network**
✅ Technology-driven services like *AP Homes App* and *Visualiser Tool*
---
### 6. **Distribution & Sales Channels**
* **Retail Dealers and Distributors** (pan-India reach)
* **Company-owned Stores** (Beautiful Homes Stores)
* **Online Platforms** (e-commerce, company apps)
* **Project Sales Teams** (for institutional clients)
---
### 7. **Key Partnerships**
* Interior designers, contractors, dealers
* E-commerce platforms for décor products
* OEMs for industrial and auto segments
---
### 8. **Cost Structure**
* Raw materials (resins, pigments, solvents)
* Manufacturing & plant operations
* Marketing, advertising, and dealer incentives
* R\&D and innovation spending
* Logistics and warehousing
---
### 9. **Innovation & Digitalization**
* AI tools for color recommendation & personalization
* Automated tinting machines at retail outlets
* AR-based visualizer for customers to preview wall colors
* Integrated interior design consultations
---
### 10. **Future Growth Drivers**
* **Premiumization** of paint products
* **Tier 2/3 city expansion** for home décor services
* Growth in **waterproofing & construction chemicals**
* Expanding **global presence** in Asia, Africa, and Middle East
* Focus on **sustainability** and green chemistry
---
## 🧠 Summary:
> Asian Paints isn’t just a paint company anymore—it's a **home transformation brand**. With a hybrid of **manufacturing excellence**, **brand power**, and **design services**, it dominates the industry with innovation and a customer-first approach.
---
Etranal Privious Known As ZomatoHere’s a detailed breakdown of the **Zomato Business Model** (2024–2025 version), structured for clarity:
---
## 🍽️ **Zomato Ltd – Business Model Overview**
**Zomato Ltd** is an Indian multinational company primarily operating in the food delivery and restaurant aggregator space. It has evolved into a full-stack food ecosystem player, with diversified revenue streams and a tech-driven service platform.
---
### 1. **Business Type**
**B2C & B2B Platform**
* B2C: Food delivery, dine-out services, Zomato Gold (now Zomato Pro), Hyperpure groceries.
* B2B: Supplies to restaurants (Hyperpure), SaaS tools for restaurants.
---
### 2. **Core Offerings**
* **Online Food Delivery** (Main revenue generator)
* **Restaurant Discovery & Reviews**
* **Table Booking & Dine-out Deals**
* **Hyperpure (B2B supply chain for restaurants)**
* **Zomato Pro/Zomato Gold Memberships**
* **Quick Commerce (via Blinkit)**
---
### 3. **Revenue Streams**
| Source | Description |
| ------------------------------- | -------------------------------------------------------------------------- |
| 🛵 **Food Delivery Commission** | Charges 15–25% commission per order from restaurants |
| 📦 **Delivery Charges** | Customer delivery fee; sometimes surge-based |
| 🛒 **Hyperpure** | Sells fresh ingredients and supplies to restaurants (B2B supply chain) |
| 💳 **Zomato Pro/Gold** | Subscription revenue from premium users for discounts and exclusive access |
| 💼 **Advertising** | Restaurants pay for listing promotions and higher visibility |
| ⚡ **Blinkit (Quick Commerce)** | Fast delivery of groceries and essentials (10–20 minute delivery) |
---
### 4. **Customer Segments**
* **Individual Consumers**: Ordering food, groceries, dining out.
* **Restaurants**: B2B services like Hyperpure, marketing, software.
* **Retail Vendors**: Via Blinkit, for grocery and essentials delivery.
---
### 5. **Key Partners**
* **Restaurants** (Partnered for delivery and dine-in offers)
* **Delivery Personnel (Gig Workers)**
* **Suppliers and Farmers** (For Hyperpure)
* **Retailers and Warehouses** (For Blinkit)
---
### 6. **Technology & App Ecosystem**
* Real-time tracking, location-based recommendations.
* AI-powered personalization, pricing, logistics.
* API and dashboards for restaurant partners.
---
### 7. **Cost Structure**
* Delivery partner payments
* Discounts, cashbacks, and offers
* Technology and infrastructure (servers, R\&D)
* Customer support and marketing
* Warehouse & logistics (Blinkit and Hyperpure)
---
### 8. **Unique Selling Points (USP)**
* Deep integration with restaurant partners
* Dual model: Marketplace (Zomato) + Fulfillment (Blinkit, Hyperpure)
* Strong brand loyalty and pan-India presence
---
### 9. **Challenges**
* High competition (Swiggy, ONDC, etc.)
* Thin profit margins in food delivery
* Regulatory compliance in gig economy and FSSAI norms
---
### 10. **Future Outlook**
* Expanding **Quick Commerce** footprint via Blinkit
* Strengthening **Hyperpure** to dominate the restaurant supply chain
* Enhancing **AI and data analytics** for personalization and efficiency
* Exploring **international expansions** cautiously
---
Nifty very positive after Rte cut and CRR cut 25200 important How to take trades using Harmonic pattern projection Trade setup is explained below :-
Entry : 1st SL point : 0% is recent top or bottom.
Trailing D: 15.1% is work as trailing SL of buy or sell trade if hit then we have to book profit
.If price goes below 2nd D 22.5% to 24.5% range then early traders can make fresh reversals trade after breaking 1st D 15.1% safe traders can reversal trade after breaking Point D 22.5.4% to 24.5% range
Targets :
Target T1 : 36.1% to 38.3%
Target T3 : 49.1% to 52.5%
T3: 60.9% to 64.8% is our 3rd Target since this is reversal zone so must book profit if break then take fresh trade again
Target T4 : 76.4% to 79.7%
Next Targets are 100% , 127.2% ,141.4% and final Target 161.8%.
How to take reversal trade :
If price going upside/ downside then then buy or sell levels appear on Chart ( Automatically show when price reach any reversal zone of harmonic projection ).
Trailing SL:
After reach 1st Target trail SL to just above or below cost ( for example we are holding sell trade from 100 1st Target 110 hit then move trailing sl to 104-105 and move SL as price move upside or Downside)
Re- Entry :
For Re-entry in any pull back Point D ( 15.1% ) is used for re-entry then SL recent high or low Point SL ( 0% ) .
Blue Line is 1st support/ Resistance
Green line is 2nd support/ resistance
Red line is 3rd Support/ resistance
Natural gas in tight range 326 to 314 let it break How to take trades using Harmonic pattern projection Trade setup is explained below :-
Entry : 1st SL point : 0% is recent top or bottom.
Trailing D: 15.1% is work as trailing SL of buy or sell trade if hit then we have to book profit
.If price goes below 2nd D 22.5% to 24.5% range then early traders can make fresh reversals trade after breaking 1st D 15.1% safe traders can reversal trade after breaking Point D 22.5.4% to 24.5% range
Targets :
Target T1 : 36.1% to 38.3%
Target T3 : 49.1% to 52.5%
T3: 60.9% to 64.8% is our 3rd Target since this is reversal zone so must book profit if break then take fresh trade again
Target T4 : 76.4% to 79.7%
Next Targets are 100% , 127.2% ,141.4% and final Target 161.8%.
How to take reversal trade :
If price going upside/ downside then then buy or sell levels appear on Chart ( Automatically show when price reach any reversal zone of harmonic projection ).
Trailing SL:
After reach 1st Target trail SL to just above or below cost ( for example we are holding sell trade from 100 1st Target 110 hit then move trailing sl to 104-105 and move SL as price move upside or Downside)
Re- Entry :
For Re-entry in any pull back Point D ( 15.1% ) is used for re-entry then SL recent high or low Point SL ( 0% ) .
Blue Line is 1st support/ Resistance
Green line is 2nd support/ resistance
Red line is 3rd Support/ resistance
Bitcoin sell given near 106000, made low 100400 near huge profitHow to take trades using Harmonic pattern projection Trade setup is explained below :-
Entry : 1st SL point : 0% is recent top or bottom.
Trailing D: 15.1% is work as trailing SL of buy or sell trade if hit then we have to book profit
.If price goes below 2nd D 22.5% to 24.5% range then early traders can make fresh reversals trade after breaking 1st D 15.1% safe traders can reversal trade after breaking Point D 22.5.4% to 24.5% range
Targets :
Target T1 : 36.1% to 38.3%
Target T3 : 49.1% to 52.5%
T3: 60.9% to 64.8% is our 3rd Target since this is reversal zone so must book profit if break then take fresh trade again
Target T4 : 76.4% to 79.7%
Next Targets are 100% , 127.2% ,141.4% and final Target 161.8%.
How to take reversal trade :
If price going upside/ downside then then buy or sell levels appear on Chart ( Automatically show when price reach any reversal zone of harmonic projection ).
Trailing SL:
After reach 1st Target trail SL to just above or below cost ( for example we are holding sell trade from 100 1st Target 110 hit then move trailing sl to 104-105 and move SL as price move upside or Downside)
Re- Entry :
For Re-entry in any pull back Point D ( 15.1% ) is used for re-entry then SL recent high or low Point SL ( 0% ) .
Blue Line is 1st support/ Resistance
Green line is 2nd support/ resistance
Red line is 3rd Support/ resistance
Crude yesterday bought at 5385 booked at 5480 , now sell riseHow to take trades using Harmonic pattern projection Trade setup is explained below :-
Entry : 1st SL point : 0% is recent top or bottom.
Trailing D: 15.1% is work as trailing SL of buy or sell trade if hit then we have to book profit
.If price goes below 2nd D 22.5% to 24.5% range then early traders can make fresh reversals trade after breaking 1st D 15.1% safe traders can reversal trade after breaking Point D 22.5.4% to 24.5% range
Targets :
Target T1 : 36.1% to 38.3%
Target T3 : 49.1% to 52.5%
T3: 60.9% to 64.8% is our 3rd Target since this is reversal zone so must book profit if break then take fresh trade again
Target T4 : 76.4% to 79.7%
Next Targets are 100% , 127.2% ,141.4% and final Target 161.8%.
How to take reversal trade :
If price going upside/ downside then then buy or sell levels appear on Chart ( Automatically show when price reach any reversal zone of harmonic projection ).
Trailing SL:
After reach 1st Target trail SL to just above or below cost ( for example we are holding sell trade from 100 1st Target 110 hit then move trailing sl to 104-105 and move SL as price move upside or Downside)
Re- Entry :
For Re-entry in any pull back Point D ( 15.1% ) is used for re-entry then SL recent high or low Point SL ( 0% ) .
Blue Line is 1st support/ Resistance
Green line is 2nd support/ resistance
Red line is 3rd Support/ resistance
Silver 105500 target hit today profit booking come in evening How to take trades using Harmonic pattern projection Trade setup is explained below :-
Entry : 1st SL point : 0% is recent top or bottom.
Trailing D: 15.1% is work as trailing SL of buy or sell trade if hit then we have to book profit
.If price goes below 2nd D 22.5% to 24.5% range then early traders can make fresh reversals trade after breaking 1st D 15.1% safe traders can reversal trade after breaking Point D 22.5.4% to 24.5% range
Targets :
Target T1 : 36.1% to 38.3%
Target T3 : 49.1% to 52.5%
T3: 60.9% to 64.8% is our 3rd Target since this is reversal zone so must book profit if break then take fresh trade again
Target T4 : 76.4% to 79.7%
Next Targets are 100% , 127.2% ,141.4% and final Target 161.8%.
How to take reversal trade :
If price going upside/ downside then then buy or sell levels appear on Chart ( Automatically show when price reach any reversal zone of harmonic projection ).
Trailing SL:
After reach 1st Target trail SL to just above or below cost ( for example we are holding sell trade from 100 1st Target 110 hit then move trailing sl to 104-105 and move SL as price move upside or Downside)
Re- Entry :
For Re-entry in any pull back Point D ( 15.1% ) is used for re-entry then SL recent high or low Point SL ( 0% ) .
Blue Line is 1st support/ Resistance
Green line is 2nd support/ resistance
Red line is 3rd Support/ resistance
Gold sell on rise until 99300 not break 96100-95500 TargetHow to take trades using Harmonic pattern projection Trade setup is explained below :-
Entry : 1st SL point : 0% is recent top or bottom.
Trailing D: 15.1% is work as trailing SL of buy or sell trade if hit then we have to book profit
.If price goes below 2nd D 22.5% to 24.5% range then early traders can make fresh reversals trade after breaking 1st D 15.1% safe traders can reversal trade after breaking Point D 22.5.4% to 24.5% range
Targets :
Target T1 : 36.1% to 38.3%
Target T3 : 49.1% to 52.5%
T3: 60.9% to 64.8% is our 3rd Target since this is reversal zone so must book profit if break then take fresh trade again
Target T4 : 76.4% to 79.7%
Next Targets are 100% , 127.2% ,141.4% and final Target 161.8%.
How to take reversal trade :
If price going upside/ downside then then buy or sell levels appear on Chart ( Automatically show when price reach any reversal zone of harmonic projection ).
Trailing SL:
After reach 1st Target trail SL to just above or below cost ( for example we are holding sell trade from 100 1st Target 110 hit then move trailing sl to 104-105 and move SL as price move upside or Downside)
Re- Entry :
For Re-entry in any pull back Point D ( 15.1% ) is used for re-entry then SL recent high or low Point SL ( 0% ) .
Blue Line is 1st support/ Resistance
Green line is 2nd support/ resistance
Red line is 3rd Support/ resistance
Gold sell until 3405 not break 3280,3250 immediate target How to take trades using Harmonic pattern projection Trade setup is explained below :-
Entry : 1st SL point : 0% is recent top or bottom.
Trailing D: 15.1% is work as trailing SL of buy or sell trade if hit then we have to book profit
.If price goes below 2nd D 22.5% to 24.5% range then early traders can make fresh reversals trade after breaking 1st D 15.1% safe traders can reversal trade after breaking Point D 22.5.4% to 24.5% range
Targets :
Target T1 : 36.1% to 38.3%
Target T3 : 49.1% to 52.5%
T3: 60.9% to 64.8% is our 3rd Target since this is reversal zone so must book profit if break then take fresh trade again
Target T4 : 76.4% to 79.7%
Next Targets are 100% , 127.2% ,141.4% and final Target 161.8%.
How to take reversal trade :
If price going upside/ downside then then buy or sell levels appear on Chart ( Automatically show when price reach any reversal zone of harmonic projection ).
Trailing SL:
After reach 1st Target trail SL to just above or below cost ( for example we are holding sell trade from 100 1st Target 110 hit then move trailing sl to 104-105 and move SL as price move upside or Downside)
Re- Entry :
For Re-entry in any pull back Point D ( 15.1% ) is used for re-entry then SL recent high or low Point SL ( 0% ) .
Blue Line is 1st support/ Resistance
Green line is 2nd support/ resistance
Red line is 3rd Support/ resistance
6th-June-FridayHi
Welcome to today’s Nifty forecast grid presented by Grid-Work’s
Huge selling in the first 3 bars
And then on the close of the 1st hour we see
A sudden and huge short covering manipulation
Only possible when market makers have already planned it
Some RBI news pls check it out
Thank you
Did this in a hurry
If you have any questions about what to look for?
When to look for ? And where to look for ?
Price action , real-time order flow interaction
And finding value with profile very effective
Enjoy safe .
EURUSD – Strong uptrend, Non-farm could trigger breakoutEURUSD continues to maintain a steady uptrend within a well-defined ascending channel. Each pullback has been well absorbed around the EMA 34–89 and the dynamic support zone near 1.13650, signaling that buyers remain in control.
Currently, price is approaching the key resistance area around 1.14840 – a level that previously triggered a rejection. If it fails to break through again, a minor pullback toward the support zone followed by a bounce, as shown in the chart, is a likely scenario.
What’s worth noting is that the Non-Farm Payroll report is due later today – a potential catalyst that could either fuel a breakout or break the current channel. If U.S. job data comes in weaker than expected, the USD may face selling pressure, providing a strong boost for the euro.
XAUUSD – Awaiting Non-Farm, will gold hold its ground?The H8 chart shows gold retesting a key resistance zone around 3,426 USD after an impressive recovery run. Price action remains solid above the rising trendline and is supported by the EMA 34–89, indicating that the bullish structure is still well intact.
However, the upper resistance zone is causing some hesitation in the market. If gold fails to break through immediately, a minor pullback toward the 3,330 – 3,290 USD area is highly possible. If this zone holds, it would present a good opportunity to rejoin the uptrend.
On the news front, today’s spotlight is the U.S. Non-Farm Payrolls report. If the jobs data comes in weaker than expected, expectations for a Fed rate cut will likely increase – a scenario that could benefit gold significantly as a non-yielding asset.
USDJPY – Downtrend Continues, 143.500 Is the Key ZoneUSDJPY is moving within a clear descending channel and is now approaching the strong resistance area at 143.500 – where the EMA 34, EMA 89, and the upper trendline all converge.
Historically, each time price touched this zone, a strong rejection followed. If the same happens again, we could see a move back down to 142.000 and potentially 140.500.
On the fundamental side, the recently released U.S. ISM Services data disappointed, fueling expectations that the Fed might cut rates sooner – adding bearish pressure to the USD.
Preferred scenario: watch for price reaction around 143.500 to enter a short position in line with the downtrend.
EURUSD – Lower highs emerging, bearish signal in sight?Although the lower-than-expected jobless claims forecast could support a mild USD recovery, EURUSD is still holding above the EMAs in the short term. However, signs of weakness have begun to appear as price continues to get rejected around the 1.14800 zone – which aligns with a descending trendline that has been tested multiple times.
Currently, EURUSD is forming a lower high pattern on the H4 chart, indicating growing selling pressure. If this pattern continues and price breaks below the 1.13800 area, a deeper correction toward the 1.13600 support zone could be triggered. This level has repeatedly supported price in the past and coincides with the confluence of the 34 and 89 EMAs.
EURUSD – Strong push but might run out of steamEURUSD has just bounced nicely off the 1.13400 support zone. Price is now climbing back toward the previous high around 1.14500 – which looks promising, but also comes with some risk. This is a level that previously triggered a strong reversal, so if price fails to break through again, a pullback toward the lower EMA region is quite possible.
On the chart, I can see price approaching the upper boundary of the ascending channel, while buying momentum seems to be fading. If we see a reversal candlestick pattern or long upper wicks forming in this area, it might be an early sign of a short-term drop.
What about the news? The latest JOLTS report shows job openings in the US are slowing down, raising concerns about the labor market. At the same time, US–China trade tensions are flaring up again, and President Trump's unclear remarks on tariffs are making investors more cautious with the USD.
BTC Breakdown or Bounce? Key Levels You Need to Watch!BTC Breakdown or Bounce? Key Levels You Need to Watch!
#Bitcoin 4H Chart Analysis – SMC Overview:
BTC is currently in a short-term downtrend, respecting a descending channel and showing clear bearish structure.
🔴 Bearish Signs:
Price rejected from 2 major Bearish Order Blocks:
▶️ $106K–$104K
▶️ $111K–$109K
Breaks of Structure (BOS) and Change of Character (CHoCH) confirm trend shift to bearish Couldn’t hold the 0.382 Fibonacci level at $104.4K — now testing the 0.5 Fib at $102.2K
🟢 Key Support Zones (Potential Reversal Areas):
1️⃣ $100K Zone
✔️ 0.618 Fib level
✔️ Unfilled Fair Value Gap (FVG)
🔍 Possible bullish reaction from here
2️⃣ $97K Zone
✔️ 0.786 Fib
✔️ Bullish Order Block (OB)
✔️ Another FVG
💥 Strong confluence — good probability of reversal
3️⃣ $93K Zone
✔️ Deep Bullish OB
🛡️ Last strong support if $97K fails
🔼 If bulls reclaim control: We need a clear CHoCH above $104.5K to confirm bullish shift
⚠️ Tip: Mark these zones. Use alerts. Let the price come to you — don’t force trades.
📢 Share if useful & stay updated
Silver continuesly buying given from 32.60 near still buy on dipHow to take trades using Harmonic pattern projection Trade setup is explained below :-
Entry : 1st SL point : 0% is recent top or bottom.
Trailing D: 15.1% is work as trailing SL of buy or sell trade if hit then we have to book profit
.If price goes below 2nd D 22.5% to 24.5% range then early traders can make fresh reversals trade after breaking 1st D 15.1% safe traders can reversal trade after breaking Point D 22.5.4% to 24.5% range
Targets :
Target T1 : 36.1% to 38.3%
Target T3 : 49.1% to 52.5%
T3: 60.9% to 64.8% is our 3rd Target since this is reversal zone so must book profit if break then take fresh trade again
Target T4 : 76.4% to 79.7%
Next Targets are 100% , 127.2% ,141.4% and final Target 161.8%.
How to take reversal trade :
If price going upside/ downside then then buy or sell levels appear on Chart ( Automatically show when price reach any reversal zone of harmonic projection ).
Trailing SL:
After reach 1st Target trail SL to just above or below cost ( for example we are holding sell trade from 100 1st Target 110 hit then move trailing sl to 104-105 and move SL as price move upside or Downside)
Re- Entry :
For Re-entry in any pull back Point D ( 15.1% ) is used for re-entry then SL recent high or low Point SL ( 0% ) .
Blue Line is 1st support/ Resistance
Green line is 2nd support/ resistance
Red line is 3rd Support/ resistance
Silver Long term Target 104600 hit continuesly buying from 96500How to take trades using Harmonic pattern projection Trade setup is explained below :-
Entry : 1st SL point : 0% is recent top or bottom.
Trailing D: 15.1% is work as trailing SL of buy or sell trade if hit then we have to book profit
.If price goes below 2nd D 22.5% to 24.5% range then early traders can make fresh reversals trade after breaking 1st D 15.1% safe traders can reversal trade after breaking Point D 22.5.4% to 24.5% range
Targets :
Target T1 : 36.1% to 38.3%
Target T3 : 49.1% to 52.5%
T3: 60.9% to 64.8% is our 3rd Target since this is reversal zone so must book profit if break then take fresh trade again
Target T4 : 76.4% to 79.7%
Next Targets are 100% , 127.2% ,141.4% and final Target 161.8%.
How to take reversal trade :
If price going upside/ downside then then buy or sell levels appear on Chart ( Automatically show when price reach any reversal zone of harmonic projection ).
Trailing SL:
After reach 1st Target trail SL to just above or below cost ( for example we are holding sell trade from 100 1st Target 110 hit then move trailing sl to 104-105 and move SL as price move upside or Downside)
Re- Entry :
For Re-entry in any pull back Point D ( 15.1% ) is used for re-entry then SL recent high or low Point SL ( 0% ) .
Blue Line is 1st support/ Resistance
Green line is 2nd support/ resistance
Red line is 3rd Support/ resistance