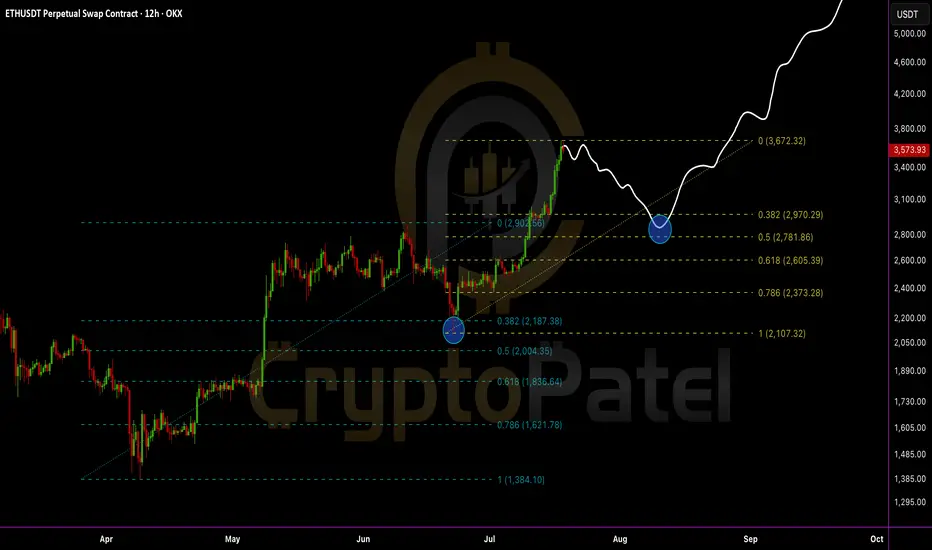
Everyone’s bullish now… but smart traders are waiting for this EEthereum just tapped a key resistance near $3,672 and is starting to show signs of cooling off.
A healthy retracement could bring ETH back to:
0.382 Fib – $2,970
0.5 Fib – $2,781
0.618 Fib – $2,605 (Strong demand zone)
IMO, we can expect ETH to revisit the $2,700–$3,000 zone before the next leg up.
This area will be the golden re-entry for long-term targets of $6,000–$8,000.
Stop-loss: Recent high and candle close above $3,675
Structure remains bullish:
✅ Previous dips into Fibs triggered strong buybacks
✅ Clean higher highs and higher lows
✅ Demand zone + retracement = opportunity
My View: Let price pull back. Then load up again. Bigger wave incoming.
DYOR | NFA
Harmonic Patterns
Divergence Secrets✅ What is Divergence?
Divergence occurs when price action and an indicator (usually a momentum oscillator) move in opposite directions. This signals a disconnection between price and momentum, often happening before significant reversals.
Most Common Indicators Used:
RSI (Relative Strength Index)
MACD (Moving Average Convergence Divergence)
Stochastic Oscillator
CCI (Commodity Channel Index)
✅ Types of Divergence
1. Regular Divergence (Classic Divergence)
Bullish Divergence: Price makes lower lows, but the indicator makes higher lows → Suggests potential upward reversal.
Bearish Divergence: Price makes higher highs, but the indicator makes lower highs → Suggests potential downward reversal.
📌 Use Case: Best applied during downtrends (bullish divergence) or uptrends (bearish divergence) to catch reversals.
2. Hidden Divergence (The Professional’s Favorite)
Bullish Hidden Divergence: Price makes higher lows, but indicator makes lower lows → Signals trend continuation upwards.
Bearish Hidden Divergence: Price makes lower highs, but indicator makes higher highs → Signals trend continuation downwards.
📌 Use Case: Hidden divergence is used to confirm trend continuation after pullbacks, ideal for trend traders.
3. Exaggerated (Extended) Divergence
Price forms equal highs/lows, but the indicator shows higher lows/lower highs → Signals momentum build-up for reversal.
📌 Use Case: Seen at range breakouts or market tops/bottoms.
✅ Why Divergence Works (Institutional View)
Liquidity Manipulation: Institutions push price to make new highs/lows to grab liquidity, but momentum slows because real volume decreases.
Momentum Imbalance: Even as price extends, internal market strength weakens, revealed through divergence.
Smart Money Accumulation/Distribution: Divergence often appears when institutions quietly build or offload positions, creating momentum shifts.
✅ Advanced Divergence Trading Secrets
🔥 Secret #1: Multi-Timeframe Divergence
Always check divergence on higher timeframes (H4, Daily), then execute entries on lower timeframes (M15, H1).
A daily divergence holds more power than M15 divergence.
🔥 Secret #2: Confluence with Support/Resistance or Order Blocks
Divergence is strongest when it happens at a key structure level (support, resistance, order block, or imbalance zone).
Don’t trade divergence alone — combine it with price reaction at major zones.
🔥 Secret #3: Wait for Structure Break Confirmation
After divergence, wait for Break of Structure (BOS) or Change of Character (CHoCH) to confirm reversal.
This filters out many false divergence signals.
🔥 Secret #4: Volume Confirmation
Confirm divergence with volume drop or volume spike reversal.
Divergence with low participation increases reversal probability.
✅ Pro Divergence Entry Method
✅ Spot Divergence at key levels.
✅ Wait for candlestick confirmation (engulfing candle, pin bar, inside bar).
✅ Look for Break of Minor Structure.
✅ Enter on retest of BOS/CHoCH zone or order block.
✅ Stop loss below swing low/high, target next liquidity pool or imbalance zone.
✅ Common Mistakes to Avoid
❌ Trading divergence without context (e.g., countering a strong trend blindly).
❌ Ignoring higher timeframe trend direction.
❌ Entering without confirmation candle or structure break.
❌ Using lagging indicators without understanding price action.
✅ Final Thoughts
Divergence is a leading indicator, but it must be combined with market structure, key levels, and confirmation price action. Professionals use divergence as a warning sign, not an instant entry trigger. By mastering divergence, you can predict market exhaustion, capture high-reward reversals, and avoid common retail traps.
Divergence is one of the hidden secrets of market timing — master it, and your trading accuracy will improve dramatically
Option Trading✅ Why Trade Options?
📊 Profit in All Market Conditions — Whether markets go up, down, or stay flat, options allow you to build strategies for every scenario.
💰 Limited Risk, High Reward — With proper strategies like buying options, you can limit your risk to the premium paid but enjoy unlimited upside.
🔒 Hedge Existing Investments — Investors use options to protect their portfolios from market crashes.
🧩 Flexibility — Options allow for creative trade setups such as income generation, speculation, and hedging.
📉 Leverage — Control larger positions with less capital.
✅ Key Concepts in Option Trading
1. Call Option (Buy Side):
Gives the buyer the right to buy an asset at a certain price before expiry.
✅ Call Buyer profits when price goes up.
✅ Call Seller (Writer) profits when price stays flat or falls.
2. Put Option (Sell Side):
Gives the buyer the right to sell an asset at a certain price before expiry.
✅ Put Buyer profits when price goes down.
✅ Put Seller profits when price stays flat or rises.
✅ Important Terms to Know
Strike Price – The fixed price at which you can buy or sell the underlying asset.
Premium – The cost paid by the option buyer to the seller for the right to exercise.
Expiry Date – The date when the option contract becomes void.
In-the-Money (ITM) – Option has intrinsic value (profitable if exercised).
Out-of-the-Money (OTM) – Option has no intrinsic value (unprofitable if exercised).
At-the-Money (ATM) – Option strike is closest to the current market price.
✅ Popular Option Trading Strategies
1. Directional Strategies:
Long Call – Profit from rising markets.
Long Put – Profit from falling markets.
2. Non-Directional Strategies:
Iron Condor – Profit from range-bound markets.
Straddle/Strangle – Profit from big movements in either direction.
Butterfly Spread – Low-cost strategy for limited movement with high reward potential.
3. Income Strategies:
Covered Call – Selling calls on owned stocks for premium income.
Cash-Secured Put – Selling puts on stocks you want to own at a lower price.
✅ Advanced Concepts for Institutional-Level Trading
📌 Implied Volatility (IV): Measures expected future volatility; options become expensive when IV rises.
📌 Theta Decay: Time decay that eats away premium, favoring option sellers.
📌 Delta, Gamma, Vega, Theta (Greeks): Quantify how option prices react to changes in market conditions.
📌 Hedging with Options: Professionals hedge large portfolios using protective puts or collars.
📌 Liquidity and Open Interest: High open interest means better liquidity, tighter spreads, and easier trade execution.
✅ Why Institutions Prefer Option Trading
Institutions, banks, and hedge funds use options to:
Hedge large stock portfolios.
Generate steady returns through premium collection.
Manage volatility exposures.
Create complex structured products.
They use strategic adjustments, rollovers, and risk-defined positions to control large portfolios with precision.
✅ Common Mistakes to Avoid in Options
❌ Trading without understanding volatility impact.
❌ Ignoring time decay when buying options.
❌ Going all-in on OTM options with low probabilities.
❌ Not managing trades near expiry.
❌ Trading without considering the Greeks.
✅ Final Thoughts
Option Trading is not gambling — it’s a professional tool for risk management, income generation, and speculation. When used correctly, options offer high flexibility, controlled risk, and diverse profit opportunities. However, success requires education, discipline, and strategy.
Learn the true power of Option Trading, master market behavior, and you will have one of the most versatile weapons in your financial toolkit
Nifty 50 - 1D Timeframe📊 Nifty 50 – Daily Chart Overview (1D Timeframe)
Current Close (July 18): Around 24,968
Change: Down ~143 points (–0.57%)
Intraday Range: High ~25,145 | Low ~24,918
52‑Week Range: 21,744 to 26,277
YTD Performance: Approximately +5.6%
📈 Technical Indicators
RSI (14-day): ~32.5
This shows that the market is entering bearish territory, but not yet oversold.
MACD: Below signal line, value ~–67
A clear sell signal, confirming negative momentum.
Stochastic Oscillator: Above 98
Indicates that the index is overbought, and a correction may be due.
ADX (Average Directional Index): ~48
Signifies a strong trend—right now, it’s favoring bearish movement.
Other Oscillators (CCI, ROC, Ultimate): Mostly giving sell signals
🧠 Market Sentiment & Context
Nifty has been bearish for the third straight week
Trading is happening below the 20-day EMA, suggesting downward pressure
Overall tone is range-bound and lacking momentum due to:
Weak quarterly earnings
Foreign investor selling
Global market uncertainty
📉 Volatility & Risk Gauge
India VIX: ~11.2 to 11.4
This is the lowest in 15 months, signaling low market fear
Low VIX often means sideways consolidation and narrow movement
📊 Put-Call Ratio (PCR) & Options View
PCR (based on open interest): ~0.80
Indicates a bearish bias
More calls being written compared to puts
🏦 Bank Nifty Overview (for Comparison)
Close: ~56,283
Drop: ~1%
RSI: ~28 (Bearish)
MACD: Sell signal
Resistance: 57,200 – 57,600
Support: 56,300 – 55,800
Bank Nifty is also showing bearish momentum and mirrors Nifty’s structure.
📅 What to Watch Next
Corporate Q1 results – especially from large caps like Reliance, HDFC, ICICI
Global cues – US inflation, interest rate decisions, global markets
India VIX – If it spikes above 14–15, market fear might return
FIIs activity – Any strong buying/selling can swing the market
✅ Summary (Daily Timeframe)
Nifty is currently weak and range-bound
Key level to hold: 24,900
Key level to break: 25,250
Momentum is with sellers; cautious approach recommended
If no trigger appears, expect sideways movement or slow decline
Master Institutional TradingWhy Master Institutional Trading?
The stock market, forex, and other financial markets are highly manipulated environments, driven by the decisions of institutional traders, banks, hedge funds, and large players. Learning how these institutions trade gives you the clarity and confidence to trade in the direction of smart money rather than becoming a victim of market traps.
With this program, you will not only learn how the markets operate but also how to read price movements like an institutional trader. You’ll master advanced techniques that allow you to identify high-probability trade setups, manage your risks like a professional, and trade with patience and precision.
Key Features of Master Institutional Trading
Smart Money Concept (SMC): Understand the core principles of smart money trading, including how large institutions accumulate and distribute assets.
Liquidity Hunting Strategies: Learn how institutions use liquidity zones, stop loss hunting, and false breakouts to trap retail traders — and how you can profit by following their footprint.
Order Block Mastery: Master the identification of order blocks, breaker blocks, and mitigation blocks — key areas where institutional orders are placed.
Market Structure & Price Action: Analyze clean price action without relying on lagging indicators. Understand market structure shifts, internal and external liquidity, and premium/discount zones.
Advanced Risk Management: Learn professional risk management techniques to control drawdowns and maximize returns, including how institutions scale in and out of positions.
Live Market Analysis: Get exposure to live trading sessions where experts explain the logic behind every trade entry and exit, based on institutional concepts.
Psychological Discipline: Develop a winning mindset focused on discipline, patience, and long-term profitability, just like professional traders working in financial firms.
Who Is This Course For?
This program is ideal for:
Traders who want to stop following retail strategies and learn real market mechanics.
Beginners who want to build a solid institutional foundation from the start.
Intermediate traders who are struggling with inconsistent results and want to level up their skills.
Experienced traders who wish to refine their market reading abilities and trade with greater precision.
Full-time or part-time traders seeking to understand price manipulation and liquidity traps.
What You’ll Gain from This Master Class
✅ The ability to track institutional footprints and predict market movements more accurately.
✅ A complete system based on price action, market structure, and liquidity analysis.
✅ Tools and strategies to avoid false signals and stop-loss hunts.
✅ Improved risk-reward ratios by trading in the direction of smart money.
✅ A professional, emotion-free approach to trading that focuses on long-term profitability.
✅ Real-world practical skills that you can apply in any market — stocks, forex, crypto, or commodities.
This is not a basic or theoretical course. The Master Institutional Trading program delivers real, professional-level trading knowledge, breaking down the hidden market mechanics that drive price action. By the end of this program, you will no longer trade like the crowd — you will trade like the institutions that move the markets
Master Candle Sticks✅ Why Candlesticks Are So Powerful
Candlesticks visually represent real-time market sentiment. Every single candlestick shows you:
Who is in control (buyers or sellers).
The strength of momentum.
Potential exhaustion or continuation.
The battle between retail traders and smart money.
Unlike indicators, which lag, candlesticks are real-time market footprints, helping traders make quick, informed decisions based on pure price action.
✅ Structure of a Candlestick
Every candlestick consists of:
Body: The range between open and close prices — shows strength or weakness.
Wick/Shadow: High and low of the session — shows rejection, liquidity grabs, or manipulation.
Color: Bullish (green/white) vs. Bearish (red/black).
The size of the body and wicks tells a story about market strength or indecision.
✅ Essential Candlestick Patterns
🔵 Reversal Patterns:
Pin Bar (Hammer/Inverted Hammer): Long wick shows rejection of price and potential reversal.
Engulfing Candles: Bullish or bearish candles fully engulf previous candle → momentum shift.
Morning Star / Evening Star: Three-candle reversal at key levels → trend change confirmation.
Doji: Indecision candle, often seen before reversals or breakouts.
🔵 Continuation Patterns:
Inside Bar: Consolidation, often leading to breakouts in the direction of trend.
Bullish/Bearish Flag: Continuation after a sharp move.
Three White Soldiers / Three Black Crows: Strong multi-candle trend confirmation.
✅ Advanced Institutional Candlestick Secrets
🔥 Secret 1: Candlesticks at Key Market Levels
Candlestick signals are most reliable at:
Order Blocks
Support & Resistance Zones
Liquidity Pools
Imbalance/Fair Value Gaps
Always combine candlestick signals with higher timeframe zones for high-probability setups.
🔥 Secret 2: Wick Rejections & Stop Loss Hunts
Institutions often push price to grab liquidity beyond a support/resistance level, shown by long wicks. Wick rejections = liquidity grab = high reversal probability.
🔥 Secret 3: Multi-Timeframe Candlestick Reading
A single higher timeframe candle (Daily, 4H) is built from multiple smaller timeframe candles. Professionals:
Use HTF direction and LTF entry.
For example, Daily bullish engulfing + M15 break of structure = precise sniper entry.
✅ How to Master Candlestick Trading
✅ Focus on clean price action, avoid overcrowding charts with indicators.
✅ Study reaction at key levels, not random patterns.
✅ Always confirm with market structure (trend direction, higher highs/lows, BOS/CHoCH).
✅ Use candlestick confluence, combining patterns with liquidity zones, order blocks, or supply/demand.
✅ Avoid low-quality signals in choppy or low-volume markets.
✅ How Institutions Use Candlesticks
Institutions manipulate candles during low liquidity periods (fakeouts).
They use time-based traps, creating bullish/bearish patterns before reversing direction.
Volume + Candlestick Analysis shows true institutional intent — e.g., high volume bullish pin bars after liquidity grab = strong upside signal.
✅ Pro Tips for Candlestick Mastery
💡 Best signals occur after liquidity grabs — false breakout + rejection wick.
💡 Always combine candlesticks with market structure shifts — don’t take isolated signals.
💡 Trade in the direction of higher timeframe momentum, even if lower timeframe gives opposite signals.
💡 In sideways markets, avoid reversal signals, favor range trades.
✅ Final Thoughts
Candlesticks are the true language of the market. By mastering candlestick trading, you’ll gain the ability to predict market moves before they happen, trade with confidence, and avoid the common mistakes of indicator-dependent retail traders.
Master Candlestick Trading is your first step to becoming a consistently profitable trader, whether in forex, stocks, crypto, or commodities
Master Institutional TradingWhat is Master Institutional Trading?
Master Institutional Trading is the advanced knowledge and skill set focused on understanding how big institutions operate in the market. It includes learning about market structure, order flow, liquidity zones, and smart money concepts. The goal is to understand where and why institutional players are placing their trades so individual traders can follow their footprint rather than trade blindly.
Key Elements of Institutional Trading
Smart Money Concepts (SMC):
This focuses on how "smart money" (institutions) moves in the market, including liquidity grabs, fakeouts, and manipulation of retail traders. Mastering SMC helps traders identify high-probability trade setups.
Order Blocks:
Institutions don’t place orders like retail traders. They use large block orders, which leave visible patterns on charts called “order blocks.” Learning to identify these helps in predicting price movements accurately.
Liquidity Pools:
Institutions hunt liquidity because they need large volumes to execute trades. Stop-loss levels and obvious support/resistance zones are common liquidity areas. Master institutional traders learn to identify where liquidity sits in the market.
Market Structure:
Understanding market structure (higher highs, lower lows, break of structure) is critical. Institutions move the market in phases — accumulation, manipulation, expansion, and distribution.
Volume and Order Flow Analysis:
Mastering institutional trading includes studying how volume flows in the market, using tools like volume profile, footprint charts, and delta analysis to see where institutional money is entering or exiting.
Benefits of Learning Master Institutional Trading
Higher Accuracy: You trade with the market makers, increasing your chance of success.
Better Risk Management: Institutional strategies often involve precise entry points and tighter stop-losses.
Avoiding Retail Traps: Most retail traders lose money because they trade in the wrong direction. Institutional trading helps you avoid these traps.
Consistency: You develop a rule-based approach, avoiding emotional decisions.
Why Institutions Dominate the Market
Institutions control over 70% of daily market volume, especially in forex, stocks, and commodities. They have advanced technologies like high-frequency trading (HFT), deep market data, and insider information that allow them to manipulate short-term price actions. By understanding their strategies, you can ride the momentum they create rather than getting trapped.
Final Thoughts
Mastering Institutional Trading is not about predicting the market but reading it correctly. By learning how institutional players think and operate, you can make more informed, disciplined, and profitable trading decisions. It transforms your trading approach from gambling to a professional strategy. This knowledge is essential for anyone serious about making consistent profits in the financial markets
#Nifty Weekly Analysis 21-06-25 to 25-06-25#Nifty Weekly Analysis 21-06-25 to 25-06-25
24900-25300 is a Sideways range. Option sellers can sell this range for next week.
If Nifty sustains above 25260, XABCD gets activated, more upside possible & targets are 25500/25650.
If Nifty trades below 24900, ABCD gets activated, more downside possible & targets are 24750/24500.
View: Monday move will decide next weeks direction because of results season.
Chainlink’s Bull Run: Up 80% After the Dip — Is $100 the Next?Chainlink’s Bull Run: Up 80% After the Dip — Is $100 the Next Target?
If you followed my chart, you likely caught the move.
✅ We entered below $10
✅ It pumped to over $30
✅ Recently dipped near $11 and another good Profit.
It’s still up 80% from our entry zone, and I believe CRYPTOCAP:LINK still has room to grow.
My updated targets: $50 / $75 / $100
Tip: Take some profits along the way and ride the trend smartly.
NFA & DYOR
EURUSD on the verge – a trap waiting for the carelessThis pair has just completed a classic rounding top, with a sharp rejection near 1.16500. Buying momentum is fading, RSI is dropping, and the recent retest of the broken trendline might have been the final warning – the “kiss of death” could already be in play.
On the fundamental side, the U.S. keeps fueling the dollar: consumer spending is rising, jobless claims are falling, and the Fed shows no sign of easing up. Meanwhile, the ECB is still searching for direction, leaving the euro exposed and vulnerable.
If the current support level breaks, EURUSD could slide quickly to lower zones. This is no longer a time for hope – it’s time to choose a side and act.
$XRP just broke its all-time high: $3.66CRYPTOCAP:XRP just broke its all-time high: $3.66 — and this is just the beginning?
After years of waiting, XRP finally explodes past $2 and hits $3.66 this bull run. It’s not just a win for XRP holders — it’s a lesson in patience, conviction, and catching early setups before the hype.
Why it matters now:
🔹 While everyone’s chasing the latest meme coin, XRP silently did a clean 7x from $0.50.
🔹 Regulatory clarity is improving — XRP’s bullish narrative is finally unfolding.
🔹 Market rotation is real: old giants like XRP are moving again, and this signals strength in Layer 1 comeback plays.
Quick breakdown:
📌 First signal at $0.50 → 7x
📌 Second entry below $2 → already 2x
📌 Current price: $3.66 (ATH)
📌 Many ignored it, some mocked it — but price tells the truth.
Patience beats hype. Quality setups > chasing pumps.
Save-worthy takeaway:
If you ever feel FOMO, remember this:
The best trades aren’t loud. They’re early, quiet… and require conviction.
What’s your biggest “I told you so” moment in this bull run?👇
Let’s hear your favorite early calls — drop them in the replies!
Technical Class✅ What You Learn in a Technical Class
1. Introduction to Technical Analysis
What is price action?
Difference between Technical and Fundamental Analysis
Basics of Candlestick Charts
2. Candlestick Patterns
Bullish and Bearish Patterns
Reversal Patterns (Doji, Hammer, Shooting Star)
Continuation Patterns (Flags, Pennants)
3. Chart Patterns
Double Top, Double Bottom
Head and Shoulders
Triangles (Ascending, Descending)
4. Indicators and Oscillators
Moving Averages (MA, EMA)
RSI (Relative Strength Index)
MACD (Moving Average Convergence Divergence)
Bollinger Bands
5. Support and Resistance
How to Identify Strong Support Zones
How to Use Resistance Levels for Entries/Exits
6. Trend Analysis
How to Spot a Trend (Uptrend, Downtrend, Sideways)
Trendlines and Channels
Breakouts and Fakeouts
7. Volume Analysis
Importance of Volume in Confirming Moves
Volume Spikes and Market Reversals
8. Risk Management
How to Protect Your Capital
Stop Loss and Take Profit Strategies
Risk-Reward Ratio
✅ Who Should Attend a Technical Class?
✅ Stock Market Beginners
✅ Intraday Traders
✅ Swing Traders
✅ Option Traders
✅ Anyone who wants practical market knowledge
XAUUSD – The Bullish Wave Emerges, Target Closer Than Ever!Gold has broken out of its previous descending channel, confirming a trend reversal. Current price action is forming higher lows while consistently filling Fair Value Gaps (FVGs) – a clear sign that institutional money is flowing back in.
The next key target is the previous high near 3,399, where some short-term profit-taking may occur. However, if buyers can defend the support zone around 3,348, the chances of breaking above resistance will increase significantly.
On the news front, the U.S. dollar is weakening as housing and industrial production data show signs of slowing, fueling speculation that the Fed may pause further rate hikes this year.
Nifty 50 – 1 Day Timeframe✅ Closing Summary:
Closing Price: ₹24,968.30
Change: −₹143.55 (−0.57%)
Opening Price: ₹25,108.55
Intraday High: ₹25,144.20
Intraday Low: ₹24,919.10
Nifty 50 traded in a narrow but bearish range throughout the session, losing nearly 0.6%, as market sentiment remained weak due to earnings pressure and global cues.
🔍 Key Reasons for the Decline:
Banking Sector Drag:
Major private sector banks like Axis Bank reported weaker-than-expected earnings, sparking a broad sell-off in financials.
Financial stocks make up a large portion of Nifty 50, pulling the entire index lower.
Cautious Investor Sentiment:
Global uncertainty regarding U.S. Federal Reserve interest rate decisions and economic slowdown concerns weighed on overall risk appetite.
Investors are also being cautious ahead of major Indian corporate earnings from companies like HDFC Bank, ICICI Bank, Reliance Industries, and others.
Foreign Institutional Selling (FII):
FIIs continued to sell Indian equities, especially large-cap financials and IT stocks.
This added selling pressure even as some domestic institutional investors tried to buy the dips.
Technical Weakness:
The index slipped below the 25,000 psychological support level, a sign of short-term technical weakness.
Intraday recoveries were capped near resistance, confirming the bearish tone.
📈 Technical Outlook (Short-Term):
Support Zone: ₹24,900 to ₹24,850
This is the next critical area. If broken, further decline toward ₹24,600 is likely.
Resistance Zone: ₹25,150 to ₹25,300
Bulls need to reclaim this zone for the trend to turn positive again.
Momentum Indicators:
RSI: Slipping below 45, showing weakening momentum.
MACD: Bearish crossover; trend remains under pressure.
Volume: Slightly above average, indicating serious selling interest at the top.
📆 Recent Trend Performance:
1-Day Return: −0.57%
1-Week Return: −0.35%
1-Month Return: +2.10%
6-Month Return: +12.8%
1-Year Return: +10.9%
Nifty 50 remains in a medium- to long-term uptrend, but short-term correction is underway, largely due to sector-specific drag and earnings volatility.
🧠 What Traders & Investors Should Know:
Day Traders: Watch for quick reversals near support at ₹24,900; consider shorting near resistance if recovery fails.
Swing Traders: Wait for either a bullish reversal candle or RSI bounce before entering fresh long positions.
Long-Term Investors: Despite the dip, the market remains healthy. This could be a buy-on-dip opportunity, especially in sectors like auto, pharma, and capital goods that are holding well.
💬 Conclusion:
Nifty 50 showed weakness on July 18 due to negative earnings surprises and bearish sentiment in financials. While technical indicators suggest short-term downside pressure, the broader long-term trend remains intact. Key support at ₹24,900 is crucial. A bounce from that zone can trigger a recovery, but a sustained break below it could accelerate the decline
NATGAS OPTION ALERT🔥 NATGAS OPTION ALERT 🔥
✅ Buy 330CE @ ₹3.45–₹4.00
🎯 Targets: ₹7 / ₹12 / ₹15
🛑 SL: ₹2.00
📍 NG Spot: ₹308–₹310
📊 Volume pickup above ₹310 = Momentum Confirmed
🧠 Trail SL after ₹6 hit
Risk: ₹1,875 per lot
Reward: ₹7K–₹14K per lot
📅 Watch till 7PM (US open) for breakout
🚨 Book partial at ₹7 and ride the rest
EURUSD under pressureEURUSD is moving within a well-defined descending channel, forming consistent lower highs and lower lows. The price has recently rejected the resistance zone near 1.16100, showing signs of continued bearish momentum.
On the fundamental side, stronger-than-expected U.S. retail sales—especially in the core figure—have boosted the U.S. dollar, putting downward pressure on the euro. Coupled with ongoing concerns about Eurozone economic growth, the pair is likely to continue its decline toward the 1.15400 support area. RSI remains below the neutral zone, confirming short-term bearish bias.
Traders should watch closely for reactions at support to assess further short opportunities.
Gold wavers under pressure from strong U.S. retail dataXAUUSD is currently fluctuating within a price box, showing weaker bullish attempts and failing to break above the nearest resistance zone. Selling pressure is mounting as price continues to be rejected at the top and is approaching the medium-term ascending trendline — a key support level.
On the news front, U.S. core retail sales surged, boosting expectations for a stronger USD, which in turn weighs on gold prices. However, a slight uptick in unemployment claims may help slow the dollar’s momentum.
If buyers fail to defend this critical support, the bullish structure risks being broken, potentially signaling a shift toward a clearer downtrend. On the flip side, the price box could still act as a consolidation phase before another bullish leg.
bullish setup spotted on CGCLCapri Global is a diversified Non-Banking Financial Company (NBFC) with a presence across diverse segments like MSME, Affordable Housing, Construction Finance segments, and Car Loan distribution; forayed into Gold Loans in Aug 22
Company is expected to give good quarter
Company has delivered good profit growth of 24.3% CAGR over last 5 years
Company's median sales growth is 31.5% of last 10 years
Bank Nifty – 1 Day Timeframe✅ Closing Summary:
Closing Price: ₹56,283.00
Change: −₹545.80 (−0.96%)
Opening Price: ₹56,524.25
Intraday High: ₹56,705.15
Intraday Low: ₹56,204.85
Bank Nifty showed broad weakness throughout the session, closing nearly 1% lower as major banking stocks came under pressure due to weak earnings and cautious sentiment in the financial sector.
🔍 Key Reasons for the Decline:
Earnings Pressure:
Axis Bank posted disappointing Q1 earnings, with higher non-performing assets and weaker loan growth.
This spooked investors, leading to sell-offs in other major banks like HDFC Bank, ICICI Bank, and Kotak Bank.
FIIs Turn Net Sellers:
Foreign Institutional Investors have been consistently selling financial stocks amid global uncertainty, which accelerated the downtrend.
Domestic buying was not strong enough to offset the outflows.
Global Economic Concerns:
Concerns about U.S. Fed interest rate hikes, inflation, and trade tensions globally made investors risk-averse.
Financials, being interest-rate sensitive, felt the brunt of the negative sentiment.
Technical Breakdown:
The index failed to hold above the crucial ₹56,500–₹56,700 range, which acted as a support in the previous few sessions.
This triggered technical selling and stop-loss hits.
📈 Technical Outlook (Short-Term):
Support Zone: ₹56,200 to ₹56,000
If this range is broken convincingly, the index could head toward ₹55,500.
Resistance Zone: ₹56,700 to ₹57,000
A move above this zone is needed for short-term recovery and renewed bullishness.
Indicators:
RSI (Relative Strength Index): Trending below 45, indicating growing bearish momentum.
MACD: Bearish crossover visible, confirming weakness.
Volume: Heavy selling pressure with above-average volumes shows institutional exit.
📆 Recent Trend Performance:
1-Day Return: −0.96%
1-Week Return: −1.12%
1-Month Return: +2.4%
6-Month Return: +14.8%
1-Year Return: +11.3%
Despite the day’s drop, medium- and long-term performance remains strong, backed by sector fundamentals and banking credit growth.
🧠 What Traders & Investors Should Know:
Intraday Traders: Can watch for bounce plays near the ₹56,200 zone, or short positions if ₹56,000 is broken with momentum.
Swing Traders: May wait for confirmation of reversal candles or bullish divergence in RSI before entering new long positions.
Long-Term Investors: Today’s fall could offer buy-on-dip opportunities, especially in quality private banks, provided fundamentals stay strong.
💬 Conclusion:
Bank Nifty faced strong bearish pressure in today’s session, largely due to disappointing bank earnings and negative institutional flows. With key support at ₹56,200 and resistance at ₹56,700–57,000, the next few days will be crucial to determine the short-term direction. If support holds, a technical bounce is possible. However, a breakdown below ₹56,000 could lead to deeper corrections
Sensex – 1 Day Timeframe✅ Closing Summary:
Closing Price: ₹82,540.65
Change: −₹501.34 (−0.60%)
Opening Price: ₹83,081.80
Intraday High: ₹83,114.95
Intraday Low: ₹82,488.25
The Sensex fell over 500 points, reflecting broad-based selling across banking, IT, and financial services. The index struggled to hold gains and faced resistance at higher levels throughout the day.
🔍 Key Reasons for the Decline:
Weak Earnings from Financials:
Axis Bank and other financial stocks reported disappointing quarterly results.
As financial stocks hold significant weight in the Sensex, this created negative sentiment across the board.
IT and Tech Sector Pressure:
Global uncertainty, U.S. Fed rate concerns, and weak guidance from global tech firms contributed to a fall in Indian IT stocks like Infosys and TCS, dragging the index.
Foreign Institutional Investor (FII) Selling:
FIIs were net sellers in July, putting pressure on large-cap blue-chip stocks.
Persistent outflows created downward pressure on the index despite support from domestic institutional buyers.
Global Market Cues:
Mixed global signals, rising oil prices, and uncertain interest rate outlooks kept risk sentiment subdued.
Caution ahead of major global economic data further prevented buying enthusiasm.
📈 Technical Outlook (Short-Term):
Support Zone: ₹82,300 to ₹82,000
This is a key demand zone. A breakdown below could lead to further downside towards ₹81,500.
Resistance Zone: ₹83,150 to ₹83,500
Any bounce-back will face selling near this region unless backed by strong buying volume.
Indicators:
RSI: Dropped below 45, indicating weakening strength.
MACD: Shows a bearish crossover, confirming short-term negative momentum.
Volume: Heavier than average, signaling increased institutional activity on the sell side.
📆 Recent Trend Performance:
1-Day Return: −0.60%
1-Week Return: −0.45%
1-Month Return: +1.85%
6-Month Return: +12.3%
1-Year Return: +11.7%
The index remains strong over the long term, but the short-term chart reflects a corrective phase amid sectoral weakness.
🧠 What Traders & Investors Should Know:
Short-Term Traders: Monitor the 82,300 level for signs of bounce or breakdown. Potential intraday setups are forming, but caution is advised.
Swing Traders: Wait for a confirmation candle—like a bullish engulfing or hammer—near the support before entering long positions.
Long-Term Investors: This correction may offer a healthy buy-on-dip opportunity, particularly in stocks with strong fundamentals in auto, capital goods, and FMCG sectors.
💬 Conclusion:
The Sensex declined nearly 0.60% due to earnings pressure from major financials and global uncertainty impacting IT and large-cap stocks. While the market sentiment remains weak in the short term, the long-term uptrend is still intact. Key support around ₹82,300 will determine the near-term direction. If held, a rebound may follow next week, especially if major earnings turn out better than expected.
NIFTY MATHEMATICAL LEVELSThese Levels are based on purely mathematical calculations.
Validity of levels are upto expiry of current week.
How to use these levels :-
* Mark these levels on your chart.
* Safe players Can use 15 min Time Frame
* Risky Traders Can use 5 min. Time Frame
* When Candle give Breakout / Breakdown to any level we have to enter with High/Low of that breaking candle.
* Targets will be another level marked on chart
* Stop Loss will be Low/High of that Breaking Candle.
* Trail your SL with every candle.
* Avoid Big Candles as SL will be high then.
* This is one of the Best Risk Reward Setup.
For Educational purpose only
HAL Stuck In Down Trend Channel Hindustan Aeronautics Limited (HAL) is India’s premier aerospace and defense company, engaged in the design, development, manufacture, repair, overhaul, and upgrade of aircraft, helicopters, engines, and related systems. Below is a detailed explanation of HAL’s **business model**:
---
### 🔷 **1. Business Overview**
* **Established:** 1940 (as Hindustan Aircraft Ltd), nationalized in 1942
* **Headquarters:** Bengaluru, Karnataka
* **Ownership:** Majority-owned by the Government of India under the Ministry of Defence
* **Core Domain:** Aerospace & Defense
* **Client Base:** Indian Defence Forces (IAF, Navy, Army), DRDO, ISRO, and select global defense companies
---
### 🔷 **2. Key Business Segments**
| Segment | Activities |
| -------------------------- | ------------------------------------------------------------------------------------------------------------------------------------------------ |
| **Aircraft** | Design, development, and production of fighter jets like LCA Tejas, trainers like HTT-40, and overhauling of Su-30 MKI, Jaguar, and Mirage 2000. |
| **Helicopters** | Manufacturing of indigenous helicopters like Dhruv (ALH), Rudra, LUH, and future Light Combat Helicopter (LCH). |
| **Engines** | Production and MRO (Maintenance, Repair & Overhaul) of aero-engines used in Indian aircraft and helicopters. |
| **Avionics & Systems** | Avionics integration, flight control systems, radar systems, and communication equipment. |
| **Space & Civil Aviation** | Components for ISRO missions (launch vehicles, satellite integration), and support to civil aviation through aircraft upgrades. |
| **MRO Services** | Lifecycle support, overhauls, spare parts supply, and modernization of aging fleet. |
---
### 🔷 **3. Revenue Model**
| Revenue Stream | Source |
| --------------------------- | -------------------------------------------------------------------------- |
| **Product Sales** | Sale of aircraft, helicopters, engines, and aerospace components |
| **MRO Services** | Maintenance, repair, and overhaul contracts from defense services |
| **R\&D and Design Charges** | Charges for technology development and customization |
| **Export Sales** | Sale of parts, sub-systems, and co-development with international partners |
> 🔸 **Major Revenue Contributor**: Over 90% of revenue comes from the Indian Ministry of Defence (MoD)
---
### 🔷 **4. Key Customers**
* **Indian Air Force (IAF)**
* **Indian Navy**
* **Indian Army**
* **Indian Coast Guard**
* **Defence Research and Development Organisation (DRDO)**
* **Indian Space Research Organisation (ISRO)**
* Select **foreign governments and companies** (for components & maintenance)
---
### 🔷 **5. Strategic Partnerships**
* **Joint Ventures**: With Safran (France), Rolls-Royce (UK), Elbit (Israel), and Russian OEMs
* **Technology Transfer**: From global OEMs for licensed production (e.g., Sukhoi, Dornier, AL-31FP engines)
---
### 🔷 **6. Competitive Advantages**
* Monopoly in Indian aerospace manufacturing
* Strong R\&D infrastructure (15+ R\&D centers)
* Government backing and policy support (Atmanirbhar Bharat, Make in India)
* Long-term contracts with stable revenue visibility
* Indigenous development capabilities (Tejas, LCH, LUH)
---
### 🔷 **7. Challenges**
* High dependence on government contracts
* Limited exports due to geopolitical factors
* Slower pace of innovation compared to private/global players
* Bureaucratic procurement cycles
* Supply chain disruptions due to global conflicts
---
### 🔷 **8. Growth Opportunities**
* Export potential for Tejas, ALH, LCH, and drones
* Growing demand for indigenous defense equipment
* MRO expansion into Southeast Asia and Africa
* Collaborations with private sector under DPP (Defence Procurement Policy)
* Space collaboration with ISRO for satellite support systems
---
### 🔷 **9. Financial Highlights (FY24)** *(Indicative Figures)*
* **Revenue:** ₹29,810 crore+
* **Net Profit:** ₹6,230 crore+
* **Order Book:** Over ₹82,000 crore
* **ROE:** \~25%
* **Dividend Yield:** \~3%
---
### 🔷 **10. Business Model Canvas (Summary)**
| **Key Partners** | DRDO, ISRO, MoD, foreign OEMs |
| --------------------- | ------------------------------------------------------ |
| **Key Activities** | Manufacturing, R\&D, MRO |
| **Value Proposition** | Indigenous, reliable, cost-effective defense solutions |
| **Customer Segments** | Indian Armed Forces, ISRO, Foreign clients |
| **Channels** | Direct Govt Contracts, MoD tenders |
| **Revenue Streams** | Sale, MRO, R\&D services, Exports |
---
Thanks & Regards
The Golden Farms of Equity